

本文详细介绍如何在 ECharts 中自定义 Legend(图例)样式。通过设置 icon 属性将默认矩形改为小圆点,并利用 legend.formatter 结合 textStyle.rich 配置富文本,实现图例中名称、百分比和数值的分列显示及颜色区分,帮助开发者快速实现复杂的图例展示需求。
ECharts 自定义 Legend 样式:图标与富文本详解
近期需要绘制一个饼图,采用 ECharts 组件库。首先加载官方提供的默认模板以确认基础样式,随后将其修改为符合需求的自定义样式。主要目标是对图例(legend)进行个性化定制,具体效果如参考图片所示。
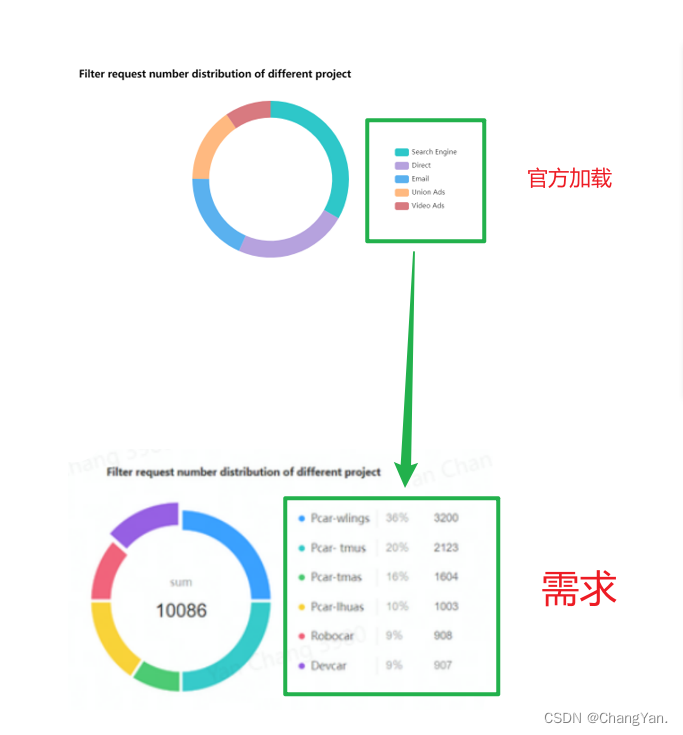
首先展示官方模板加载后的初始代码配置。
      this.chart.setOption({
        title: {
          text: "Filter request number distribution of different project",
          textStyle: {
            color: 'black',
            fontWeight: 'bold'
          }
        },
        tooltip: {
          trigger: 'item'
        },
        legend: {       //对图形的解释部分
          orient: 'vertical',
          right: 10,
          y: 'center'
        },
        series: [
          {
            name: 'Access From',
            type: 'pie',
            radius: ['55%', '70%'],
            avoidLabelOverlap: false,
            label: {
              show: false,
              position: 'center'
            },
            emphasis: {
              label: {
                show: true,
                fontSize: '20',
                fontWeight: 'bold'
              }
            },
            labelLine: {
              show: false
            },
            data: data // 需要加载的数据
          }
        ]
      })
以下是需要加载的基础数据示例。
            data: [
              { value: 1048, name: 'Search Engine' },
              { value: 735, name: 'Direct' },
              { value: 580, name: 'Email' },
              { value: 484, name: 'Union Ads' },
              { value: 300, name: 'Video Ads' }
            ]
在官方默认配置的基础上进行后续修改。
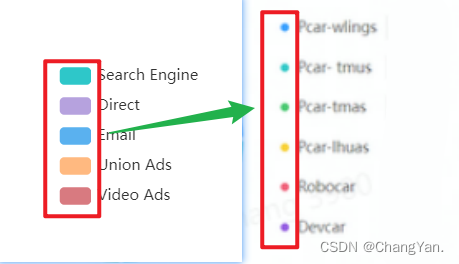
修改图例图标为圆形
观察默认效果可知,图例图标默认为长方形,而实际需求要求显示为小圆点。
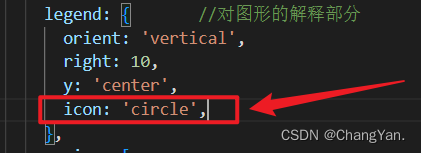
在配置项中设置相应属性即可将图标变为小圆点。
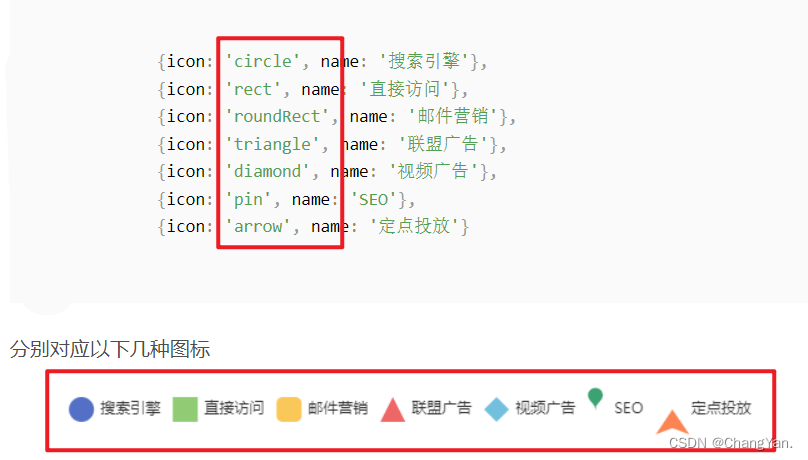
如需使用其他类型的图标,可参考相关图示说明。
配置图例富文本与多行显示
接下来处理右侧文字显示问题,要求不仅展示名称(name),还需同时显示百分比和具体数量。
这需要通过 legend.formatter 进行配置,同时结合 legend.textStyle. rich 实现。在 rich 配置块中,可以定义富文本样式,使得三列文字中中间一列显示为灰色,两侧文字保持黑色。
具体的官方样式设置教程可参考:https://echarts.apache.org/zh/option.html#legend.formatter
以下是对实现过程的具体分析。
首先将文字内容划分为三段,分别用 a 表示名称(name),b 表示百分比,c 表示数值(value)。
随后在 textStyle 中分别设置各段的样式。修改后的代码如下,请注意标注【添加】的部分为关键修改点。
      this.chart.setOption({
        title: {
          text: 'Filter request number distribution of different project',
          textStyle: {
            color: 'black',
            fontWeight: 'bold'
          }
        },
        tooltip: {
          trigger: 'item'
        },
        legend: { // 对图形的解释部分
          orient: 'vertical',
          right: 10,
          y: 'center',
          icon: 'circle',			// 添加
          formatter: function(name) {	// 添加
            let total = 0
            let target
            for (let i = 0; i < data.length; i++) {
              total += data[i].value
              if (data[i].name === name) {
                target = data[i].value
              }
            }
            var arr = [
              '{a|' + name + '}',
              '{b|' + ((target / total) * 100).toFixed(2) + '%}',
              '{c|' + target + '}'
            ]
            return arr.join('  ')
          },
          textStyle: {	// 添加
            padding: [8, 0, 0, 0],
            rich: {
              a: {
                fontSize: 15,
                width: 110
              },
              b: {
                fontSize: 15,
                width: 70,
                color: '#c1c1c1'
              },
              c: {
                fontSize: 15
              }
            }
          }
        },
        series: [
          {
            name: 'Access From',
            type: 'pie',
            radius: ['55%', '70%'],
            center: ['30%', '50%'],
            avoidLabelOverlap: false,
            label: {
              show: false,
              position: 'center'
            },
            emphasis: {
              label: {
                show: true,
                fontSize: '20',
                fontWeight: 'bold'
              }
            },
            labelLine: {
              show: false
            },
            data: data
          }
        ]
      })
最终加载出的样式效果如图参考图所示。
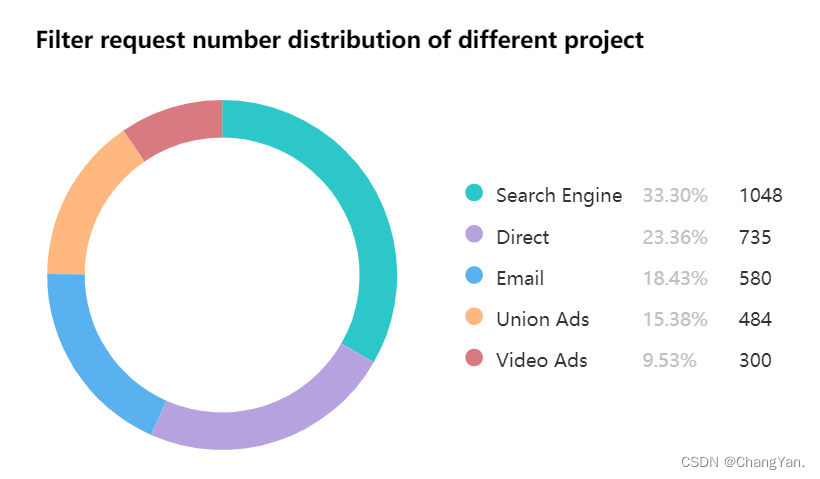
至此,自定义图例样式的配置完成。
总结
以上就是关于 ECharts 自定义 Legend 样式的详细介绍,更多相关 ECharts 自定义 Legend 样式内容请搜索本站以前的文章或继续浏览下面的相关文章,希望大家以后多多支持本站!