

本文介绍如何在ECharts中实现堆叠柱状图柱子之间的间隔效果。核心技巧是利用itemStyle中的borderColor和较大的borderWidth值,通过白色边框撑开柱子间距,无需修改series数据即可实现视觉上的间隔。
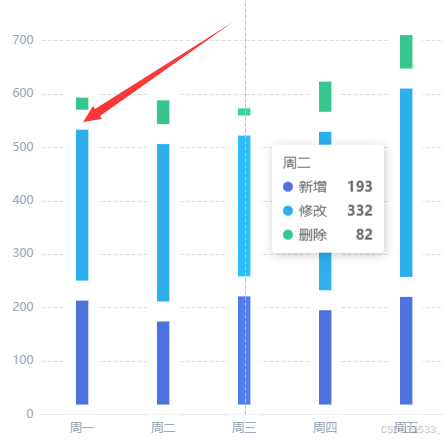
ECharts堆叠柱状图柱子间隔实现方案
https://echarts.zhangmuchen.top/#/detail?cid=85095-9454-8a93-b33d7-999a76a3
itemStyle: { //柱子颜色
	normal: {
		color: '#4e73de',
		borderColor: "#fff",// 用border做
		borderWidth: 10,
	}
},
具体实现方法如下:
    option = {
    	backgroundColor: '#fff',
    	title: {
    		text: "策略变更",
    		top: 10,
    		left: 15,
    		textStyle: {
    			color: "#35598d",
    			fontSize: 16,
    			fontWeight: 'normal'
    		}
    	},
    	tooltip: {
    		trigger: 'axis',
    	},
    	grid: {
    		left: '5%',
    		right: '6%',
    		bottom: '3%',
    		top: '20%',
    		containLabel: true
    	},
    	legend: {
    		icon: 'rect',
    		right: "3%",
    		top: 13,
    		itemWidth: 20,
    		itemHeight: 10,
    		textStyle: {
    			color: '#555'
    		},
    		data: ['新增', '修改', '删除']
    	},
    	xAxis: {
    		type: 'category',
    		data: ['周一', '周二', '周三', '周四', '周五', '周六', '周日'],
    		axisLabel: { //坐标轴字体颜色
    			textStyle: {
    				color: '#9eaaba'
    			}
    		},
    		axisLine: {
    			lineStyle: {
    				color: "#e5e5e5"
    			}
    		},
    		axisTick: { //y轴刻度线
    			show: false
    		},
    		splitLine: { //网格
    			show: false,

    		}
    	},
    	yAxis: {
    		type: 'value',
    		axisLabel: { //坐标轴字体颜色
    			textStyle: {
    				color: '#9eaaba'
    			}
    		},
    		axisLine: {
    			show: false,
    		},
    		axisTick: { //y轴刻度线
    			show: false
    		},
    		splitLine: { //网格
    			show: true,
    			lineStyle: {
    				color: '#dadde4',
    				type: "dashed"
    			}
    		}
    	},
    	series: [{
    		name: '新增',
    		type: 'bar',
    		stack: '策略变更',
    		barWidth: '40%', //柱子宽度
    		itemStyle: { //柱子颜色
    			normal: {
    				color: '#4e73de',
    				borderColor: "#fff",
    				borderWidth: 10,
    			}
    		},
    		data: [232, 193, 240, 214, 239, 223, 202]
    	}, {
    		name: '修改',
    		type: 'bar',
    		stack: '策略变更',
    		barWidth: '40%', //柱子宽度
    		itemStyle: { //柱子颜色
    			normal: {
    				color: '#2dafeb',
    				borderColor: "#fff",
    				borderWidth: 10,
    			}
    		},
    		data: [320, 332, 301, 334, 390, 330, 320]
    	}, {
    		name: '删除',
    		type: 'bar',
    		stack: '策略变更',
    		barWidth: '40%', //柱子宽度
    		itemStyle: { //柱子颜色
    			normal: {
    				color: '#35c68d',
    				borderColor: "#fff",
    				borderWidth: 10,
    			}
    		},
    		data: [60, 82, 51, 94, 100, 68, 74]
    	}]
    };
总结
至此,关于echarts堆叠柱状图实现柱子间隔的教程已结束,如需了解更多相关echarts堆叠柱状图间隔技巧,请查阅本站往期文章或继续浏览后续内容,感谢大家的支持!