

本文介绍如何利用jqPlot库结合Ajax技术,实现前端页面的动态CPU监控折线图。通过定时器定期获取服务器最新数据,并重新渲染图表以展示实时趋势。文章提供了完整的JavaScript代码示例,包括初始化图表、获取历史数据及更新视图的具体实现逻辑。
jqPlot动态折线图实现原理
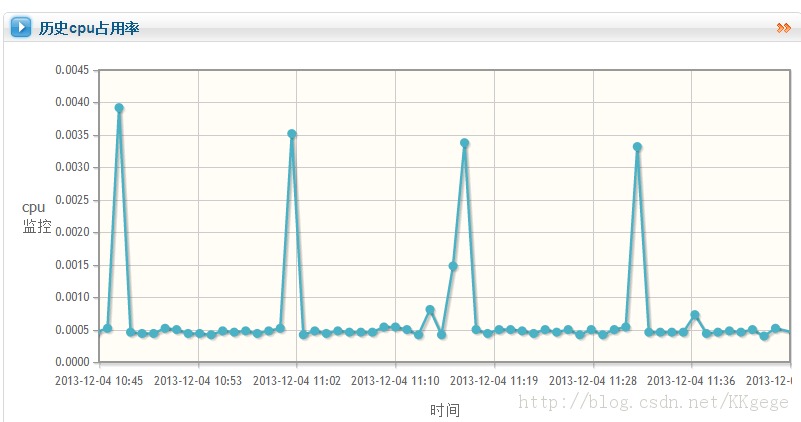
效果如图所示,每隔五秒钟图表会刷新一次(实际上是重新绘制整张图),用于显示监控到的CPU信息。
pastCpuInfomation函数主要用于初始化并显示一张静态的折线图。
updateCpuPic函数的作用是移除五秒前的旧图表,并根据当前最新的数据重新绘制一张新的图表。
updateCpuInfomation函数的功能是将最新的监控数据点添加到存储折线数据的数组中。
接着在界面中设置两个定时器,分别每5秒执行一次updateCpuPic,每1分钟执行一次updateCpuInfomation,从而使图表产生动态效果。
补充说明:代码中在执行多项操作前,会先通过Ajax获取服务器的当前时间。由于Ajax代码编写较为杂乱,且不确定是否符合规范,此外实现动态图表的方法可能并非最优(理想情况是直接更新线条数据而非重绘),希望各位朋友多多指教。绘制图表的核心代码部分已用红色标出(第30行到60行)。
完整JavaScript代码示例
具体代码如下:
var past_cpu_service_statistics_line = new Array();
var plot;
function pastCpuInfomation() {
// 历史cpu数据
// 本地时间
$.ajax({
type: "POST",
contentType: "application/x-www-form-urlencoded;charset=UTF-8",
url: globalObj.path + '/server/getServerCurrentTime.htm',
success: function(currentTime){
console.log("取到服务器时间"+currentTime);
//获取历史cpu数据
$.ajax({
type: "POST",
contentType: "application/x-www-form-urlencoded;charset=UTF-8",
url: globalObj.path + '/server/getPastCpuMonitorData.htm',
// startTime endtime 是伪数据,时间在后台获取
data: "hostName=" + "login.cheos.cn",
success: function(result){
for (key in result) {
// 去得到时间转化为int
var intKey = parseInt(key);
var transferTime = new Date(intKey);
console.log("transferTime:"+ key + "----resut:" + transferTime);
var onePoint = [transferTime, result[key]];
past_cpu_service_statistics_line.push(onePoint);
                    }
<span style="color:#ff0000;"> // 历史cpu情况表
plot= $.jqplot('cpuHistory',[ past_cpu_service_statistics_line ],
                            {
axes: {
xaxis: {
label: '时间',
renderer: $.jqplot.DateAxisRenderer,
tickOptions: {
formatString: '%Y-%#m-%d %H:%M'
                                        },
min : (currentTime -1000 * 60 * 60),
max: (currentTime),
// 横(纵)坐标显示的最小值
// ticks:['']
                                    },
yaxis: {
label: 'cpu监控',
                                    }
                                },
highlighter: {
show: true,
sizeAdjust : 7.5
                                },
cursor: {
show: false
                                }
                            });
</span>
                },
error: function(textStatus){
alert("获取监控信息失败!");
                }
            });
//获取历史cpu数据ajax结束
        },
error: function(textStatus){
alert("取历史cpu数据时候获取服务器时间失败!");
        }
    });
}
function updateCpuPic() {
console.log("正在更新cpu视图");
//先取得服务器时间,用来画横坐标
$.ajax({
type: "POST",
contentType: "application/x-www-form-urlencoded;charset=UTF-8",
url: globalObj.path + '/server/getServerCurrentTime.htm',
success: function(result){
var intKey =parseInt(result);
var transferTime = new Date(intKey);
console.log("获取到服务器时间:"+result+"------"+transferTime);
//操作图表
//如果已经存在图表,则摧毁
if (plot) {
// plot.destory();
"#cpuHistory").unbind();
"#cpuHistory").empty();
plot= null;
            }
//重新画图表
plot= $.jqplot('cpuHistory',[ past_cpu_service_statistics_line ], {
axes: {
xaxis: {
label: '时间',
renderer: $.jqplot.DateAxisRenderer,
tickOptions: {
formatString: '%Y-%#m-%d %H:%M'
                        },
min: (result - 1000 * 60 * 60),
max: (result),
// 横(纵)坐标显示的最小值
// ticks:['']
                    },
yaxis: {
label: 'cpu监控',
                    }
                },
highlighter: {
show: true,
sizeAdjust: 7.5
                },
cursor: {
show: false
                },
replot: {
resetAxes: true
                }
            });
        },
error: function(textStatus){
alert("获取服务器时间失败!");
        }
    });

}
function updateCpuInfomation() {
$.ajax({
type: "POST",
contentType: "application/x-www-form-urlencoded;charset=UTF-8",
url: globalObj.path + '/server/getLatestCpuMonitorData.htm',
data: "hostName=" + "login.cheos.cn",
success: function(result){
// 更新一次数据
for (key in result) {
var intKey = parseInt(key);
var transferTime = new Date(intKey);
console.log("----------------更新cpu信息---:" + key + "----更新时间:" + transferTime);
var onePoint = [transferTime, result[key]];
past_cpu_service_statistics_line.push(onePoint);
            }
// 更新图表
// updateCpuPic();
        },
error: function(textStatus){
alert("更新cpu信息失败!");
        }
    });
}