

本文介绍如何在Echarts中利用zrender扩展自定义图形,实现由三个面组成的伪3D柱形图。通过定义CubeLeft、CubeRight和CubeTop形状,注册到Echarts,并在series中使用custom类型和renderItem返回group对象,完成视觉上的3D效果。
前言
在前端大屏开发中,某模块需展示一种由三个面构成的伪3D柱形图。本文记录实现过程,供后续自定义图形开发时参考。该实现涉及zrender相关方法,并查阅了zrender的示例与文档。
1.自定义图形最后的效果是这样的:

该图形由三个面组成,需分别定义左侧面、顶部面和右侧面,对应命名为cubeleft、cubetop和cuberight。
2.注册自定义的图形
参考Echarts官方文档:Documentation - Apache ECharts
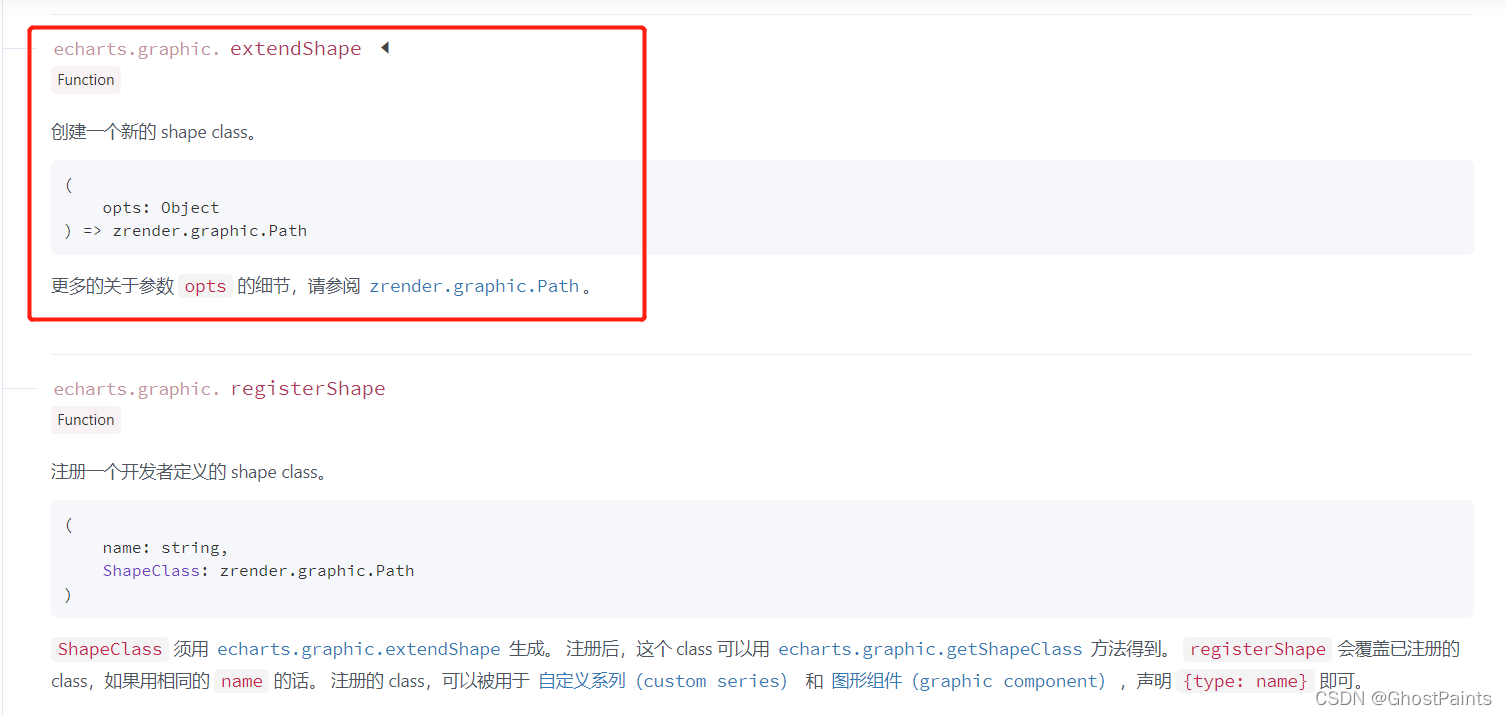
需定义一个图形类,并通过Echarts注册该类,之后即可通过类名调用。
3.extendShape
            // 绘制左侧面
            const CubeLeft = echarts.graphic.extendShape({
                    shape: {
                        x: 0,
                        y: 0
                    },
                    buildPath: function(ctx, shape) {
                        const xAxisPoint = shape.xAxisPoint
                        const c0 = [shape.x, shape.y]
                        const c1 = [shape.x - 13, shape.y - 13]
                        const c2 = [xAxisPoint[0] - 13, xAxisPoint[1] - 13]
                        const c3 = [xAxisPoint[0], xAxisPoint[1]]
                        ctx.moveTo(c0[0], c0[1]).lineTo(c1[0], c1[1]).lineTo(c2[0], c2[1]).lineTo(c3[0], c3[1]).closePath()
                    }
             })
            // 绘制右侧面
            const CubeRight = echarts.graphic.extendShape({
                    shape: {
                        x: 0,
                        y: 0
                    },
                    buildPath: function(ctx, shape) {
                        const xAxisPoint = shape.xAxisPoint
                        const c1 = [shape.x, shape.y]
                        const c2 = [xAxisPoint[0], xAxisPoint[1]]
                        const c3 = [xAxisPoint[0] + 18, xAxisPoint[1] - 9]
                        const c4 = [shape.x + 18, shape.y - 9]
                        ctx.moveTo(c1[0], c1[1]).lineTo(c2[0], c2[1]).lineTo(c3[0], c3[1]).lineTo(c4[0], c4[1]).closePath()
                    }
                })
            // 绘制顶面
            const CubeTop = echarts.graphic.extendShape({
                    shape: {
                        x: 0,
                        y: 0
                    },
                    buildPath: function(ctx, shape) {
                        const c1 = [shape.x, shape.y]
                        const c2 = [shape.x + 18, shape.y - 9]
                        const c3 = [shape.x + 5, shape.y - 22]
                        const c4 = [shape.x - 13, shape.y - 13]
                        ctx.moveTo(c1[0], c1[1]).lineTo(c2[0], c2[1]).lineTo(c3[0], c3[1]).lineTo(c4[0], c4[1]).closePath()
                    }
             })
此部分重点在于理解buildpath方法的用法。zrender官方文档未直接说明该方法的两个参数含义,仅提供了示例,通过示例可明确参数的具体用途。
示例网址:https://github.com/ecomfe/zrender/blob/master/test/pin.html
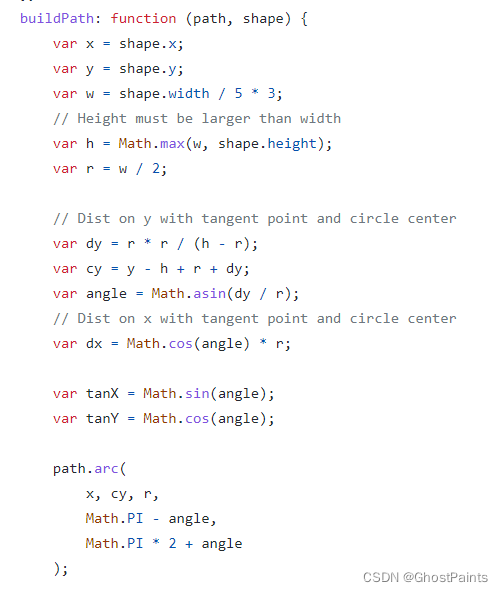
第一个参数为path,可理解为Canvas中的绘制画笔,用于设置路径并闭合路径。
第二个参数在Echarts中由自定义custom传递而来,通过该对象可获取xAxisPoint属性。
在绘制的两个面中,仅左侧面和右侧面需要填充高度,顶部面无需填充,因此顶部形状未使用xAxisPoint属性。
这符合逻辑,因为伪圆柱体内的填充物具有高度,填充量由数据决定,从而呈现从底部逐渐增多的视觉效果。
以较简单的顶部面为例:
buildPath: function(ctx, shape) {
    const c1 = [shape.x, shape.y]
    const c2 = [shape.x + 18, shape.y - 9]
    const c3 = [shape.x + 5, shape.y - 22]
    const c4 = [shape.x - 13, shape.y - 13]
    ctx.moveTo(c1[0], c1[1]).lineTo(c2[0], c2[1]).lineTo(c3[0], c3[1]).lineTo(c4[0],c4[1]).closePath()
}
绘制的四边形由四个顶点构成,只需使用moveTo控制路径,并在最后一个点闭合即可。偏移量为固定值,可根据需求调整以扭曲四边形形状。
其中c1为底部顶点,c2为右侧顶点,c3为顶部顶点,c4为另一侧顶点。其他两个面的定义类似。
4.使用echarts注册这三个图形
                // 注册三个面图形
            echarts.graphic.registerShape('CubeLeft', CubeLeft)
            echarts.graphic.registerShape('CubeRight', CubeRight)
            echarts.graphic.registerShape('CubeTop', CubeTop)
5.使用自定义的形状
其他数据配置与正常使用Echarts相同,区别在于series的配置。
series数组中放置两个对象,第一个对象如下:
{
                type: 'custom',
                renderItem: function(params, api) {
                    const location = api.coord([api.value(0), api.value(1)])
                    return {
                        type: 'group',
                        children: [{
                            type: 'CubeLeft',
                            shape: {
                                api,
                                x: location[0],
                                y: location[1],
                                xAxisPoint: api.coord([api.value(0), 0])
                            },
                            style: {
                                fill: 'rgba(47,102,192,.27)',
                                stroke: 'black'
                            },
                            z2: 999
                        }, {
                            type: 'CubeRight',
                            shape: {
                                api,
                                x: location[0],
                                y: location[1],
                                xAxisPoint: api.coord([api.value(0), 0])
                            },
                            style: {
                                fill: 'rgba(59,128,226,.27)',
                                stroke: 'black'
                            },
                            z2: 999
                        }, {
                            type: 'CubeTop',
                            shape: {
                                api,
                                x: location[0],
                                y: location[1],
                                xAxisPoint: api.coord([api.value(0), 0])
                            },
                            style: {
                                fill: 'rgba(72,156,221,.27)',
                                stroke: 'black'
                            },
                            z2: 999
                        }]
                    }
                },
                data: MAX
}
核心在于renderItem内的逻辑,该方法返回一个对象,即自定义的group组。renderItem可返回的对象类型在文档中有说明:Documentation - Apache ECharts
定义的三个面需视为整体,因此renderItem返回类型为group的对象,并将三个形状作为children保存在数组中。
其中的shape参数将在buildpath中使用。
style中设置了填充颜色和边框线颜色,并使用z2将Echarts显示层级设为最高。若不设置,下方填充图形可能将其遮挡。
此处仅定义了第一个自定义形状,即最外层的伪3D柱体。第二个自定义形状用于填充内容。
{
                type: 'custom',
                renderItem: (params, api) => {
                    const location = api.coord([api.value(0), api.value(1)])
                    var color = new echarts.graphic.LinearGradient(
                        0, 0, 0, 1, [{
                                offset: 1,
                                color: "#FEFD53"
                            },
                            {
                                offset: 0,
                                color: "#f7c824"
                            }
                        ]
                    );
                    return {
                        type: 'group',
                        children: [{
                            type: 'CubeLeft',
                            shape: {
                                api,
                                xValue: api.value(0),
                                yValue: api.value(1),
                                x: location[0],
                                y: location[1],
                                xAxisPoint: api.coord([api.value(0), 0])
                            },
                            style: {
                                fill: color,
                                stroke: 'red'
                            }
                        }, {
                            type: 'CubeRight',
                            shape: {
                                api,
                                xValue: api.value(0),
                                yValue: api.value(1),
                                x: location[0],
                                y: location[1],
                                xAxisPoint: api.coord([api.value(0), 0])
                            },
                            style: {
                                fill: color,
                                stroke: 'red'
                            }
                        }, {
                            type: 'CubeTop',
                            shape: {
                                api,
                                xValue: api.value(0),
                                yValue: api.value(1),
                                x: location[0],
                                y: location[1],
                                xAxisPoint: api.coord([api.value(0), 0])
                            },
                            style: {
                                fill: color,
                                stroke: 'red'
                            }
                        }]
                    }
                },
                data: VALUE
}
内部填充图形使用线性渐变颜色填充,边框为红色。与第一个形状不同,style中的样式及data使用的数据也不同。此处data使用value具体数值,而外壳图形使用max最大值。由此形成红色边框的渐变填充图形,嵌套于黑色边框的柱体中。
至此,自定义完成一个视觉上的3D柱体形状图表。
总结
到此这篇关于Echarts自定义图形的文章就介绍到这了,更多相关Echarts自定义图形内容请搜索本站以前的文章或继续浏览下面的相关文章希望大家以后多多支持本站!