

本文介绍在React环境中,如何利用ResizeObserver监听DOM元素尺寸变化,结合echarts的resize方法,实现折线图随容器宽度自动重绘。通过引入resize-observer-polyfill库解决浏览器兼容性问题,并提供完整的代码实现与步骤说明。
需求描述
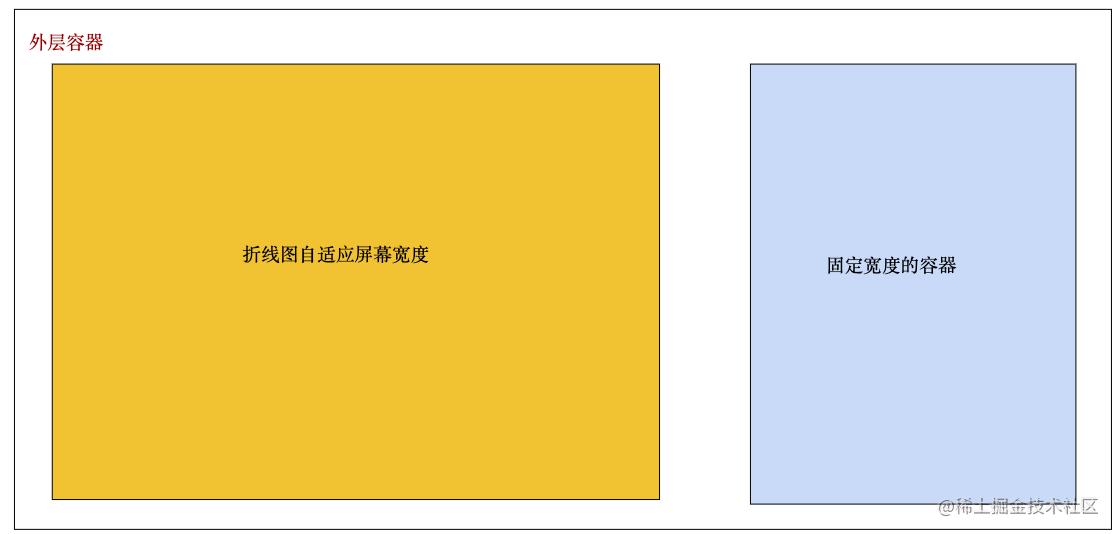
如上图所见,在开发过程中经常会遇到容器自适应展示的功能,那么如果在需要自适应宽高的容器内,echarts折线图要怎么处理呢?
改造前代码实现流程
import React, { useRef, useEffect } from 'react';
import ReactDom from 'react-dom';
import * as echarts from 'echarts';

const Test =  () => {
  const divRef = useRef < HTMLDivElement > (null);
  const chart = useRef < echarts.ECharts > (null);
  const fontColor = "#30eee9";

  useEffect(() => {
    if (!divRef.current) return;
    let myChart = chart.current;
    if (!myChart) {
      chart.current = myChart;
      myChart = echarts.init(divRef.current);
      const option = {
        backgroundColor: "#11183c",
        grid: {
          left: "5%",
          right: "10%",
          top: "20%",
          bottom: "15%",
          containLabel: true,
        },
        tooltip: {
          show: true,
          trigger: "item",
        },
        legend: {
          show: true,
          x: "center",
          y: "35",
          icon: "stack",
          itemWidth: 10,
          itemHeight: 10,
          textStyle: {
            color: "#1bb4f6",
          },
          data: ["已采纳", "已发布"],
        },
        xAxis: [
          {
            type: "category",
            boundaryGap: false,
            axisLabel: {
              color: fontColor,
            },
            axisLine: {
              show: true,
              lineStyle: {
                color: "#397cbc",
              },
            },
            axisTick: {
              show: false,
            },
            splitLine: {
              show: false,
              lineStyle: {
                color: "#195384",
              },
            },
            data: [
              "1月",
              "2月",
              "3月",
              "4月",
              "5月",
              "6月",
              "7月",
              "8月",
              "9月",
              "10月",
              "11月",
              "12月",
            ],
          },
        ],
        yAxis: [
          {
            type: "value",
            name: "",
            min: 0,
            max: 1000,
            axisLabel: {
              formatter: "{value}",
              textStyle: {
                color: "#2ad1d2",
              },
            },
            axisLine: {
              lineStyle: {
                color: "#27b4c2",
              },
            },
            axisTick: {
              show: false,
            },
            splitLine: {
              show: true,
              lineStyle: {
                color: "#11366e",
              },
            },
          },
        ],
        series: [
          {
            name: "已采纳",
            type: "line",
            stack: "总量",
            symbol: "circle",
            symbolSize: 8,
            itemStyle: {
              normal: {
                color: "#0092f6",
                lineStyle: {
                  color: "#0092f6",
                  width: 1,
                }
              },
            },
            markPoint: {
              itemStyle: {
                normal: {
                  color: "red",
                },
              },
            },
            data: [120, 132, 101, 134, 90, 230, 210, 182, 191, 234, 290, 330],
          },
          {
            name: "已发布",
            type: "line",
            stack: "总量",
            symbol: "circle",
            symbolSize: 8,

            itemStyle: {
              normal: {
                color: "#00d4c7",
                lineStyle: {
                  color: "#00d4c7",
                  width: 1,
                },
              },
            },
            data: [220, 182, 191, 234, 290, 330, 310, 201, 154, 190, 330, 410],
          },
        ],
      };

      option && myChart.setOption(option);
    }
  }, []);

  return  <div style={{ width: '100%', height: 280 }} ref={divRef}/>
};
代码思路
上述功能基于React和React Hook实现。在页面渲染前获取DOM元素,若成功获取则插入Echarts配置项。当前逻辑将获取DOM与渲染方法置于useEffect中,导致折线图无法根据容器宽度自适应显示。因此,需要监听容器宽高变化并动态重绘。
处理方案
利用ResizeObserver对象监听指定DOM元素(如div)的尺寸变化(width、height等)。由于部分浏览器原生不支持该监听对象,需引入第三方库进行支持-resize-observer-polyfill。
第一步,安装依赖库:npm install resize-observer-polyfill;
第二步,在页面中引入库:import ResizeObserver from 'resize-observer-polyfill';
第三步,使用ResizeObserver监听渲染折线图的DOM元素。当监听到该DOM元素的宽高发生变化时,调用Echarts提供的resize事件进行重绘。
第四步,在页面组件销毁时,断开所有被ResizeObserver监听的节点,释放资源。
最终代码
import React, { useRef, useEffect } from 'react';
import ReactDom from 'react-dom';
import * as echarts from 'echarts';
 // 关键代码
import ResizeObserver from 'resize-observer-polyfill';

const Test = () => {
  const divRef = useRef < HTMLDivElement > (null);
  const chart = useRef < echarts.ECharts > (null);
  // 关键代码
  const myObserver = useRef < ResizeObserver > (null);
  const fontColor = "#30eee9";

  useEffect(() => {
    if (!divRef.current) return;
    let myChart = chart.current;
    if (!myChart) {
      chart.current = myChart;
      myChart = echarts.init(divRef.current);
      const option = {
        backgroundColor: "#11183c",
        grid: {
          left: "5%",
          right: "10%",
          top: "20%",
          bottom: "15%",
          containLabel: true,
        },
        tooltip: {
          show: true,
          trigger: "item",
        },
        legend: {
          show: true,
          x: "center",
          y: "35",
          icon: "stack",
          itemWidth: 10,
          itemHeight: 10,
          textStyle: {
            color: "#1bb4f6",
          },
          data: ["已采纳", "已发布"],
        },
        xAxis: [
          {
            type: "category",
            boundaryGap: false,
            axisLabel: {
              color: fontColor,
            },
            axisLine: {
              show: true,
              lineStyle: {
                color: "#397cbc",
              },
            },
            axisTick: {
              show: false,
            },
            splitLine: {
              show: false,
              lineStyle: {
                color: "#195384",
              },
            },
            data: [
              "1月",
              "2月",
              "3月",
              "4月",
              "5月",
              "6月",
              "7月",
              "8月",
              "9月",
              "10月",
              "11月",
              "12月",
            ],
          },
        ],
        yAxis: [
          {
            type: "value",
            name: "",
            min: 0,
            max: 1000,
            axisLabel: {
              formatter: "{value}",
              textStyle: {
                color: "#2ad1d2",
              },
            },
            axisLine: {
              lineStyle: {
                color: "#27b4c2",
              },
            },
            axisTick: {
              show: false,
            },
            splitLine: {
              show: true,
              lineStyle: {
                color: "#11366e",
              },
            },
          },
        ],
        series: [
          {
            name: "已采纳",
            type: "line",
            stack: "总量",
            symbol: "circle",
            symbolSize: 8,
            itemStyle: {
              normal: {
                color: "#0092f6",
                lineStyle: {
                  color: "#0092f6",
                  width: 1,
                }
              },
            },
            markPoint: {
              itemStyle: {
                normal: {
                  color: "red",
                },
              },
            },
            data: [120, 132, 101, 134, 90, 230, 210, 182, 191, 234, 290, 330],
          },
          {
            name: "已发布",
            type: "line",
            stack: "总量",
            symbol: "circle",
            symbolSize: 8,

            itemStyle: {
              normal: {
                color: "#00d4c7",
                lineStyle: {
                  color: "#00d4c7",
                  width: 1,
                },
              },
            },
            data: [220, 182, 191, 234, 290, 330, 310, 201, 154, 190, 330, 410],
          },
        ],
      };
        //关键代码, 利用observe监听折线图所在容器的宽度变化(divRef.current),在ResizeObserver回掉函数中entries返回的内容可以获取的到;最后将获取到宽度赋值给resize方法进行重绘
      myObserver.current = new ResizeObserver((entries) => {
        myChart?.resize(entries[0]?.contentRect.width);
      });
      myObserver.current.observe(divRef.current);
      myChart.setOption(option);
    }

    //关键代码
      return () => {
      if (chart?.current) chart.current.dispose();
      //取消所有被ResizeObserver对象监听的节点
      myObserver.current?.disconnect();
    };
  }, []);

  return (
    <div className='line' style={{ width: '100%', height: 280 }} ref={divRef} />
  )
};
总结
到此这篇关于Echarts折线图如何根据容器宽度自适应展示的文章就介绍到这了,更多相关Echarts折线图宽度自适应内容请搜索本站以前的文章或继续浏览下面的相关文章希望大家以后多多支持本站!