
深入讲解如何使用D3.js绘制支持层级折叠、动态过渡与视口缩放平移的交互式思维导图。包含数据建模、坐标轴对换映射、三段式渲染管道及完整可运行代码。

当前位置:首页 > JavaScript 项目实战 > 正文
怎么使用D3.js绘制动态可交互的思维导图
作者:青柠
时间:2026-11-17
浏览:339
文章目录
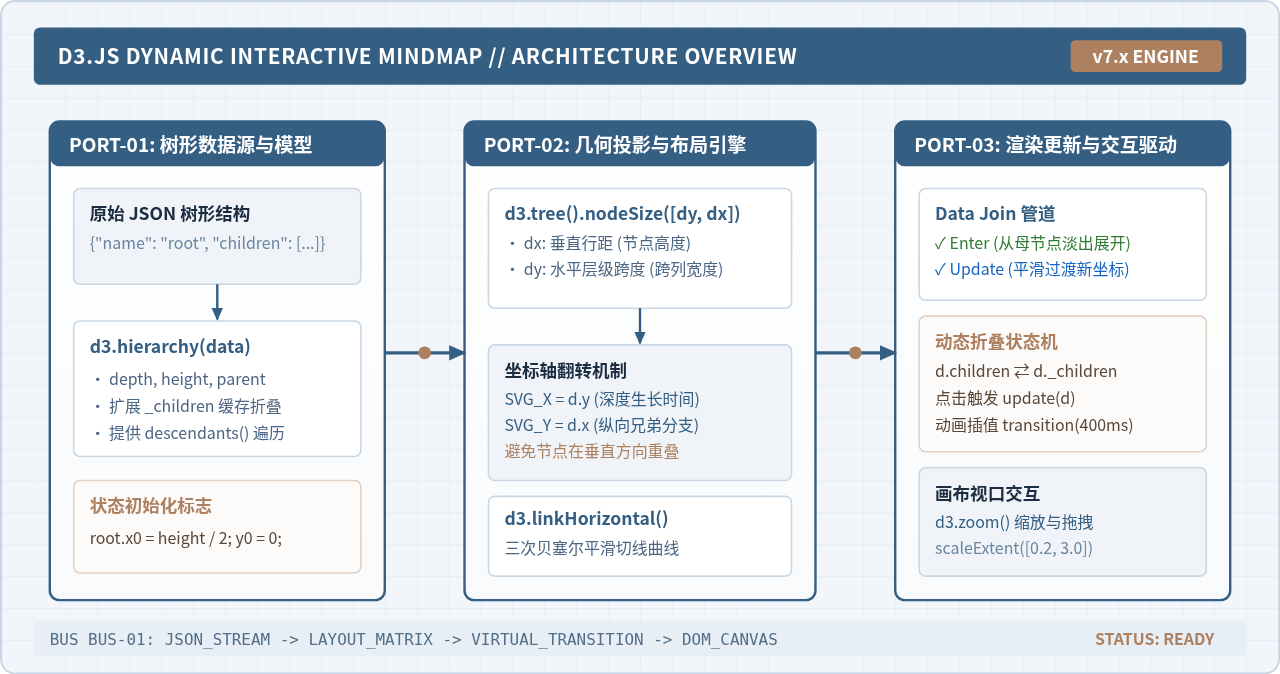
使用 D3.js 绘制动态可交互思维导图的核心解决路径是:将树形层级数据(Hierarchy Data)通过
d3.hierarchy 实例化,借助 d3.tree 布局算法将逻辑节点计算为二维平面物理坐标,再将标准笛卡尔坐标系的 X 轴与 Y 轴对换以构建横向生长的树形骨架;通过贝塞尔曲线(d3.linkHorizontal)绘制父子连接线,在闭包内管理节点的展开与折叠状态(children 与 _children 的互换),配合 selection.transition() 实现平滑插值动画,并挂载 d3.zoom 实现画布的缩放与漫游。
一、准备工作与树形数据结构设计
思维导图在本质上是一种具象化的“树形拓扑网络”(Tree Network)。在 D3.js 的架构中,数据驱动视图遵循自顶向下的层级展开原则。在正式编码前,需要引入 D3.js 运行时环境,并规范层级数据的字段定义。
1. 环境引入
推荐使用 D3.js v7 版本。可以通过页面直接引入 CDN 脚本,或在现代前端工程中通过 npm 安装:
<!-- 通过现代 CDN 载入 D3.js v7 -->
<script src="https://d3js.org/d3.v7.min.js"></script>
2. 基础数据模型规范
D3.js 的树形布局要求数据具备父子嵌套关系。每个节点对象应包含名称字段 name(或用于显示的任意标识)以及存放子节点的数组 children。当节点为叶子节点时,children 字段可为空或省略。以下是标准的输入数据样例:
const mindmapData = {
  name: "核心技术雷达",
  children: [
    {
      name: "前端工程化",
      children: [
        { name: "模块化构建 (Vite / Webpack)" },
        { name: "类型系统 (TypeScript)" },
        { name: "自动化测试 (Jest / Vitest)" }
      ]
    },
    {
      name: "可视化与图形学",
      children: [
        { name: "声明式可视化 (D3.js / Observable Plot)" },
        { name: "WebGL / Three.js 渲染引擎" },
        { name: "Canvas 2D 像素处理" }
      ]
    },
    {
      name: "服务端与运维",
      children: [
        { name: "容器化部署 (Docker / K8s)" },
        { name: "微服务架构与 RPC" }
      ]
    }
  ]
};
二、坐标轴对换与树形布局数学原理
初学者使用 D3.js 绘制思维导图时最容易遇到的困惑是:调用 d3.tree() 默认生成的是从上至下垂直排布的组织架构图,而思维导图通常要求从左向右横向生长。解决这一问题的关键在于坐标对换映射(Coordinate Projection)。
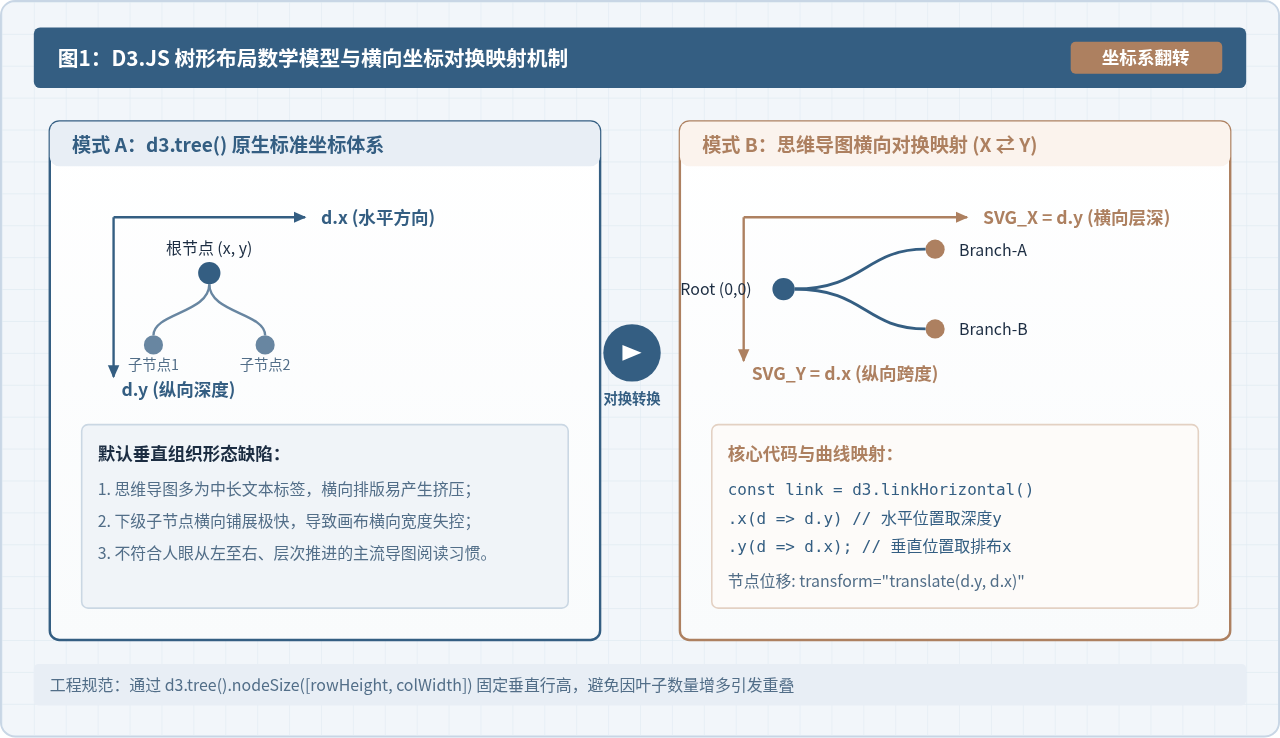
如上图所示,在 D3 原生坐标系中:
d.x代表节点在当前层级横截面上的分布位置(默认横坐标);d.y代表节点距离根节点的深度距离(默认纵坐标,即d.depth * levelDistance)。
在思维导图中,为了让长文本标签拥有充裕的水平展示空间,并将分支自然向右延展,需要进行坐标互换:将计算出的 d.y 作为 SVG 的水平位移 translate(x),将计算出的 d.x 作为 SVG 的垂直位移 translate(y)。对应的连接线则由垂直贝塞尔曲线改为横向三次贝塞尔曲线 d3.linkHorizontal():
// 构建横向平滑三次贝塞尔曲线生成器
const linkGenerator = d3.linkHorizontal()
  .x(d => d.y)  // 横向物理位置取树深 y
  .y(d => d.x); // 纵向物理位置取兄弟节点排布 x
注意事项:建议使用
d3.tree().nodeSize([rowHeight, colWidth]) 代替固定画幅的 size([height, width])。通过指定单个节点的垂直间距(如 40px)和水平跨列间距(如 180px),能有效避免当子节点数量剧增时出现的上下重叠与文字挤压。
三、动态思维导图的核心开发流水线
实现可交互思维导图的核心在于编写一个可重复调用的 update(source) 驱动函数。该函数在初始化和每次节点点击时被触发,完成数据过滤、坐标重算与 DOM 增量补丁。
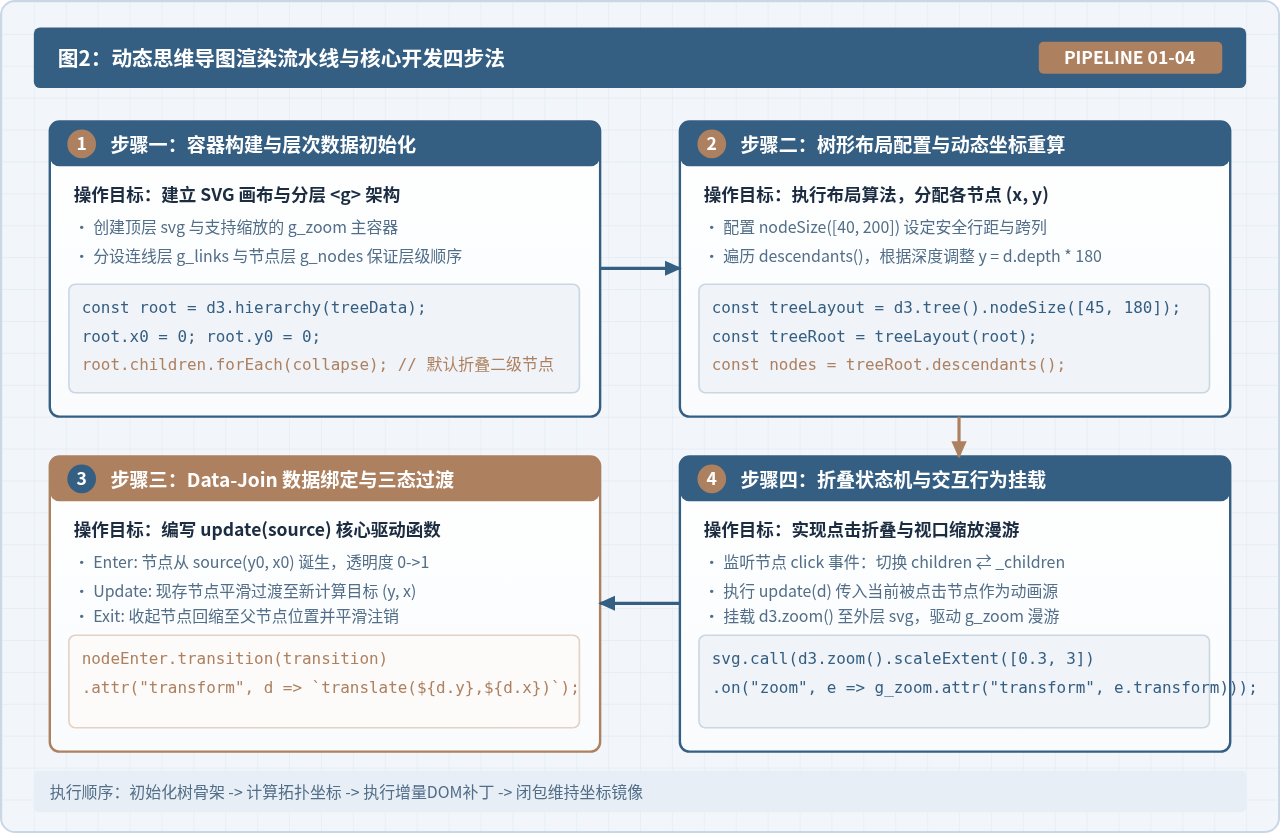
1. 第一步:初始化 SVG 视口与层级容器
在 HTML 容器中创建 SVG 画布,并依次创建两个 <g> 分层容器。必须保证 g_links(连线层)位于 g_nodes(节点层)之前,从而确保节点文字和按钮永远浮于连接线之上:
const width = 1000;
const height = 600;

// 创建顶层 SVG 画布
const svg = d3.select("#mindmap-chart")
  .append("svg")
  .attr("width", width)
  .attr("height", height)
  .attr("viewBox", [-100, -height / 2, width, height]);

// 创建供缩放漫游的外层容器
const gZoom = svg.append("g").attr("class", "zoom-container");

// 分别创建连线层与节点层,维持图层顺序
const gLinks = gZoom.append("g").attr("class", "links-layer");
const gNodes = gZoom.append("g").attr("class", "nodes-layer");
2. 第二步:将原始数据转换为 D3 层次节点
使用 d3.hierarchy() 递归包装数据,为每个节点注入 depth、height 和 parent 属性,并初始化记录初始动画展开原点的 x0 与 y0:
const root = d3.hierarchy(mindmapData);

// 记录瞬时坐标,作为首次展开的动画原点
root.x0 = 0;
root.y0 = 0;

// 递归函数:缓存子节点以支持折叠
function collapse(d) {
  if (d.children) {
    d._children = d.children;
    d._children.forEach(collapse);
    d.children = null;
  }
}

// 默认折叠根节点以下所有第二级分支(可按需配置)
if (root.children) {
  root.children.forEach(child => {
    if (child.children) child.children.forEach(collapse);
  });
}
3. 第三步:编写核心增量渲染函数 update(source)
update(source) 接收触发事件的源节点 source,作为动画产生或收缩的基准点。以下为完整的更新管道实现:
let nodeIdCounter = 0; // 全局自增 ID 保证唯一 Key
const duration = 400;  // 过渡动画时长 (毫秒)

function update(source) {
  // 1. 计算当前的树形拓扑几何分布
  const treeLayout = d3.tree().nodeSize([45, 190]);
  const treeData = treeLayout(root);

  const nodes = treeData.descendants();
  const links = treeData.links();

  // 根据深度微调各层级的水平跨度 (可按需调整)
  nodes.forEach(d => {
    d.y = d.depth * 180;
  });

  // ----------------- 节点数据绑定 (Nodes Data-Join) -----------------
  const nodeSelection = gNodes.selectAll("g.node")
    .data(nodes, d => d.id || (d.id = ++nodeIdCounter));

  // Enter 阶段:新节点从 source 节点的原始坐标诞生
  const nodeEnter = nodeSelection.enter().append("g")
    .attr("class", "node")
    .attr("transform", d => `translate(${source.y0},${source.x0})`)
    .attr("fill-opacity", 0)
    .attr("stroke-opacity", 0)
    .style("cursor", "pointer")
    .on("click", (event, d) => {
      event.stopPropagation();
      toggleNode(d);
      update(d);
    });

  // 绘制节点外圈圆标
  nodeEnter.append("circle")
    .attr("r", 7)
    .attr("fill", d => d._children ? "#AD8060" : "#345E82")
    .attr("stroke", "#FFFFFF")
    .attr("stroke-width", 2);

  // 绘制折叠/展开指示符号 (+ / -)
  nodeEnter.append("text")
    .attr("class", "toggle-icon")
    .attr("dy", "0.3em")
    .attr("text-anchor", "middle")
    .attr("fill", "#FFFFFF")
    .attr("font-size", "10px")
    .text(d => d._children ? "+" : (d.children ? "-" : ""));

  // 绘制节点文字说明
  nodeEnter.append("text")
    .attr("dy", "0.32em")
    .attr("x", d => d.children || d._children ? -12 : 12)
    .attr("text-anchor", d => d.children || d._children ? "end" : "start")
    .text(d => d.data.name)
    .attr("fill", "#1C2D42")
    .attr("font-size", "13px")
    .clone(true).lower() // 绘制一层浅色描边,防止与背景或重叠线互相干扰
    .attr("stroke-linejoin", "round")
    .attr("stroke-width", 3)
    .attr("stroke", "#FFFFFF");

  // Update 阶段:平滑过渡到位
  const nodeUpdate = nodeSelection.merge(nodeEnter).transition().duration(duration)
    .attr("transform", d => `translate(${d.y},${d.x})`)
    .attr("fill-opacity", 1)
    .attr("stroke-opacity", 1);

  nodeUpdate.select("circle")
    .attr("fill", d => d._children ? "#AD8060" : (d.children ? "#345E82" : "#6886A1"));

  nodeUpdate.select("text.toggle-icon")
    .text(d => d._children ? "+" : (d.children ? "-" : ""));

  // Exit 阶段:收起的子节点回缩到 source 节点位置并淡出注销
  nodeSelection.exit().transition().duration(duration).remove()
    .attr("transform", d => `translate(${source.y},${source.x})`)
    .attr("fill-opacity", 0)
    .attr("stroke-opacity", 0);

  // ----------------- 连线数据绑定 (Links Data-Join) -----------------
  const linkSelection = gLinks.selectAll("path.link")
    .data(links, d => d.target.id);

  // Enter 阶段:连线从父节点瞬时位置拉伸展开
  const linkEnter = linkSelection.enter().append("path")
    .attr("class", "link")
    .attr("fill", "none")
    .attr("stroke", "#C8D6E5")
    .attr("stroke-width", 1.8)
    .attr("d", d => {
      const o = { x: source.x0, y: source.y0 };
      return linkGenerator({ source: o, target: o });
    });

  // Update 阶段:过渡到真实贝塞尔几何位置
  linkSelection.merge(linkEnter).transition().duration(duration)
    .attr("stroke", "#345E82")
    .attr("d", linkGenerator);

  // Exit 阶段:连线缩回 source 节点并销毁
  linkSelection.exit().transition().duration(duration).remove()
    .attr("d", d => {
      const o = { x: source.x, y: source.y };
      return linkGenerator({ source: o, target: o });
    });

  // 记录每个节点的当前坐标,为下一次动画提供起始锚点
  nodes.forEach(d => {
    d.x0 = d.x;
    d.y0 = d.y;
  });
}
四、动态交互实现:节点折叠与视口漫游
静态树图与动态交互思维导图的本质区别在于对内存状态突变与用户视口变换的处理能力。
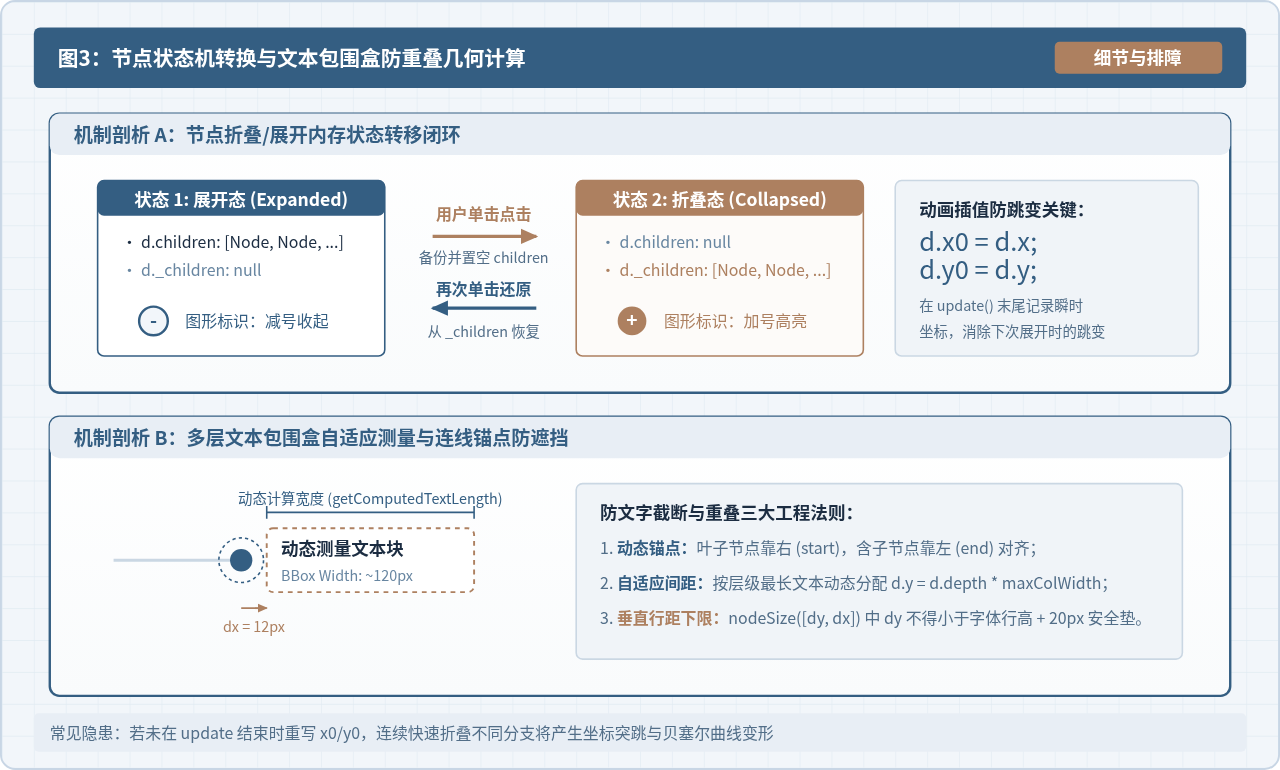
1. 展开/折叠状态机逻辑
在 JavaScript 中通过闭包维护 children 与 _children 属性的互换:
- 当节点处于展开状态时:
d.children存有真实子节点数组,d._children为null; - 当点击展开节点时:将
d.children备份至d._children,并将d.children赋值为null; - 当点击折叠节点时:将
d._children还原至d.children,并将d._children赋值为null。
function toggleNode(d) {
  if (d.children) {
    d._children = d.children;
    d.children = null;
  } else if (d._children) {
    d.children = d._children;
    d._children = null;
  }
}
2. 视口漫游与画布缩放 (Pan & Zoom)
大型思维导图展开后通常会超出浏览器默认显示区域。通过调用 d3.zoom(),将视口位移矩阵绑定在 svg 容器上,并将变换直接应用到子层 gZoom:
// 配置视口缩放与平移行为
const zoomBehavior = d3.zoom()
  .scaleExtent([0.2, 3.0]) // 限制缩放倍率范围为 0.2x 至 3.0x
  .on("zoom", (event) => {
    gZoom.attr("transform", event.transform);
  });

// 挂载至顶层 SVG
svg.call(zoomBehavior);

// 双击重置画布至居中位置 (可选配置)
svg.on("dblclick.zoom", () => {
  svg.transition().duration(500).call(
    zoomBehavior.transform,
    d3.zoomIdentity.translate(80, height / 2).scale(1)
  );
});
五、完整可运行代码示例
将上述所有模块整合,即可在独立 HTML 页面中运行完整的动态交互思维导图。代码包含样式定义、数据结构、SVG 初始化、动态更新函数与缩放控制器:
<!DOCTYPE html>
<html lang="zh-CN">
<head>
  <meta charset="UTF-8">
  <title>D3.js 动态交互思维导图演示</title>
  <script src="https://d3js.org/d3.v7.min.js"></script>
  <style>
    body { margin: 0; background: #F8FAFC; overflow: hidden; }
    #chart-container { width: 100vw; height: 100vh; }
    .node circle { transition: r 0.2s; }
    .node:hover circle { stroke: #AD8060; stroke-width: 3px; }
    .node text { font-family: sans-serif; user-select: none; }
    .link { stroke-linecap: round; }
  </style>
</head>
<body>
  <div id="chart-container"></div>

  <script>
    const treeData = {
      name: "D3.js 核心技术栈",
      children: [
        {
          name: "数据驱动基础",
          children: [
            { name: "选择集 (Selections)" },
            { name: "数据绑定 (Data Join)" },
            { name: "过渡动画 (Transitions)" }
          ]
        },
        {
          name: "层次布局系统",
          children: [
            { name: "d3.hierarchy 内存建模" },
            { name: "d3.tree 树状投影" },
            { name: "d3.cluster 聚类布局" },
            { name: "d3.treemap 矩形树图" }
          ]
        },
        {
          name: "交互反馈系统",
          children: [
            { name: "d3.zoom 视口漫游" },
            { name: "d3.drag 拖拽响应" },
            { name: "DOM 自定义事件派发" }
          ]
        }
      ]
    };

    const container = document.getElementById("chart-container");
    const width = container.clientWidth;
    const height = container.clientHeight;

    const svg = d3.select("#chart-container")
      .append("svg")
      .attr("width", width)
      .attr("height", height);

    const gZoom = svg.append("g");
    const gLinks = gZoom.append("g");
    const gNodes = gZoom.append("g");

    const zoom = d3.zoom()
      .scaleExtent([0.1, 3])
      .on("zoom", e => gZoom.attr("transform", e.transform));
    svg.call(zoom);

    // 初始位置稍微靠左居中
    svg.call(zoom.transform, d3.zoomIdentity.translate(120, height / 2));

    const root = d3.hierarchy(treeData);
    root.x0 = 0;
    root.y0 = 0;

    let idCounter = 0;
    const linkGenerator = d3.linkHorizontal().x(d => d.y).y(d => d.x);

    function update(source) {
      const treeLayout = d3.tree().nodeSize([42, 190]);
      const tree = treeLayout(root);
      const nodes = tree.descendants();
      const links = tree.links();

      nodes.forEach(d => d.y = d.depth * 180);

      // Node Join
      const nodeSel = gNodes.selectAll("g.node")
        .data(nodes, d => d.id || (d.id = ++idCounter));

      const nodeEnter = nodeSel.enter().append("g")
        .attr("class", "node")
        .attr("transform", d => `translate(${source.y0},${source.x0})`)
        .attr("fill-opacity", 0)
        .style("cursor", "pointer")
        .on("click", (e, d) => {
          e.stopPropagation();
          if (d.children) {
            d._children = d.children;
            d.children = null;
          } else if (d._children) {
            d.children = d._children;
            d._children = null;
          }
          update(d);
        });

      nodeEnter.append("circle")
        .attr("r", 7)
        .attr("fill", d => d._children ? "#AD8060" : "#345E82")
        .attr("stroke", "#FFF")
        .attr("stroke-width", 2);

      nodeEnter.append("text")
        .attr("dy", "0.32em")
        .attr("x", d => (d.children || d._children) ? -12 : 12)
        .attr("text-anchor", d => (d.children || d._children) ? "end" : "start")
        .text(d => d.data.name)
        .attr("font-size", "13px")
        .attr("fill", "#1C2D42");

      const nodeUpdate = nodeSel.merge(nodeEnter).transition().duration(350)
        .attr("transform", d => `translate(${d.y},${d.x})`)
        .attr("fill-opacity", 1);

      nodeUpdate.select("circle")
        .attr("fill", d => d._children ? "#AD8060" : (d.children ? "#345E82" : "#6886A1"));

      nodeSel.exit().transition().duration(350).remove()
        .attr("transform", d => `translate(${source.y},${source.x})`)
        .attr("fill-opacity", 0);

      // Link Join
      const linkSel = gLinks.selectAll("path.link")
        .data(links, d => d.target.id);

      const linkEnter = linkSel.enter().append("path")
        .attr("class", "link")
        .attr("fill", "none")
        .attr("stroke", "#345E82")
        .attr("stroke-width", 1.8)
        .attr("d", d => {
          const o = { x: source.x0, y: source.y0 };
          return linkGenerator({ source: o, target: o });
        });

      linkSel.merge(linkEnter).transition().duration(350)
        .attr("d", linkGenerator);

      linkSel.exit().transition().duration(350).remove()
        .attr("d", d => {
          const o = { x: source.x, y: source.y };
          return linkGenerator({ source: o, target: o });
        });

      nodes.forEach(d => {
        d.x0 = d.x;
        d.y0 = d.y;
      });
    }

    update(root);
  </script>
</body>
</html>
六、细节优化与生产环境避坑指南
在实际工程开发中,思维导图往往面临复杂的业务文本、不规则数据及高频交互,容易出现动画突跳、文本重叠和事件穿透等典型缺陷。
| 异常表现 | 根本诱因 | 工程规范与修复方案 |
|---|---|---|
| 节点展开时发生瞬时位移突跳 | 未在 update() 结束时将当前计算出的物理位置同步写回 d.x0 = d.x 与 d.y0 = d.y。 |
在 update() 函数末尾执行 nodes.forEach(d => { d.x0 = d.x; d.y0 = d.y; }),为下一次动画提供连续插值起点。 |
| 长文本与后置子节点连线交叉覆盖 | 固定写死了层级跨度 d.y = d.depth * 180,未根据每层最长文本宽度进行弹性补偿。 |
在预处理阶段按 d.depth 归类计算每层节点文本的最大像素宽度,动态累加分配 d.y。 |
| 点击折叠时整个画布发生缩放抖动 | 节点点击事件向上冒泡到了顶层 svg 容器,触发了 d3.zoom 的默认判定。 |
在节点的 click 处理函数首行显式调用 event.stopPropagation() 阻断事件扩散。 |
| 快速连续点击导致图形元素错位残留 | Data-Join 时未使用唯一的 id 绑定,导致 D3 使用默认的数组索引绑定出现错位。 |
严格使用全局自增 ID 或业务主键绑定:.data(nodes, d => d.id)。 |
七、总结:交互式思维导图的核心运转矩阵
使用 D3.js 开发动态可交互思维导图,本质上是运用“树形拓扑算法”、“声明式数据绑定”和“瞬时状态插值”三者的紧密协同:
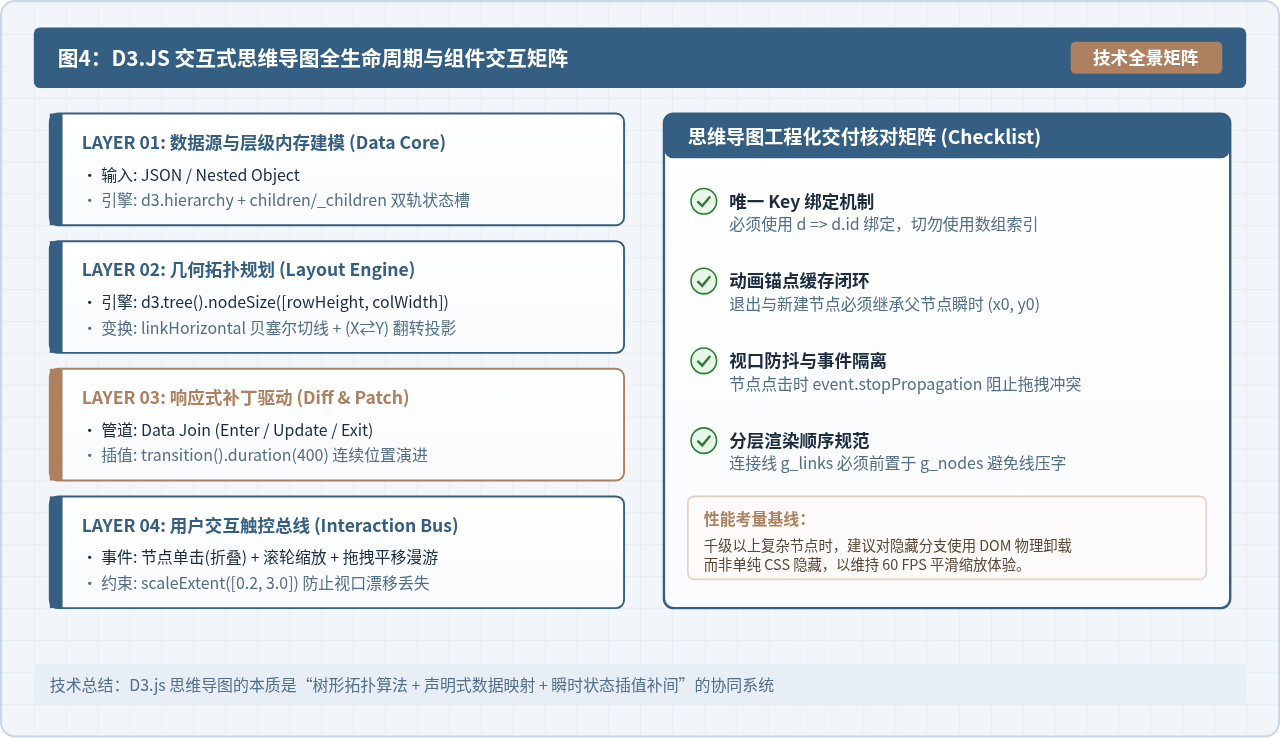
掌握了 d3.hierarchy 的数据拓扑结构、d3.tree 与 d3.linkHorizontal 的坐标对换投影、children/_children 的内存状态转移,以及 update(source) 的三态补丁循环,即可在生产环境中快速定制出兼具平滑动画与稳定交互的专业思维导图可视化组件。
实用工具推荐
电子包浆
使用 ›绿化、压缩、噪点和虚拟水印,自由调节做旧程度。
图片压缩
使用 ›选择画质和输出格式,预览压缩前后的大小。
作者最新文章
相关文章