

本文介绍如何利用ECharts自定义系列(custom series)的renderItem函数,结合api.value()和api.coord()方法,手动拼装数据以统计X轴区间的Y轴数量。通过替代ecStat.js处理,解决特定场景下的数据报错问题,并提供完整代码示例与效果展示。
ECharts X轴区间统计需求
在某些数据可视化场景中,我们需要对ECharts图表进行自定义配置,以统计X轴特定区间内Y轴的数据数量。
自定义系列实现思路
实现这一需求的核心思路是使用ECharts的自定义系列配置,具体通过option.series[i].type='custom'中的renderItem(params, api)函数来处理数据。该函数接收两个参数:params用于获取每个dataItem的数据信息,api则提供可调用的方法,包括api.value()和api.coord()。更详细的使用说明可参考ECharts官方文档。
以下示例基于官方提供的直方图实例(https://www.echartsjs.com/examples/editor.html?c=bar-histogram)进行修改。主要改动是将原本引用ecStat.js进行数据处理的部分,替换为手动拼装符合所需格式的数据逻辑。
数据手动拼装方案
var bins = ecStat.histogram(girth);
var min = Infinity;
var max = -Infinity;
edata = echarts.util.map(bins.data, function (item, index) {
 var x0 = bins.bins[index].x0;
 var x1 = bins.bins[index].x1;
 interval = x1 - x0;
 min = Math.min(min, x0);
  max = Math.max(max, x1);
  return [x0, x1, item[1]];
});
替代ecStat.js的原因
之所以进行上述改写,是因为在直接引用ecStat.js处理数据时,偶尔会出现未定义的错误,且目前尚未找到直接的解决途径。

代码效果展示
经过改写后的代码运行效果如下图所示:
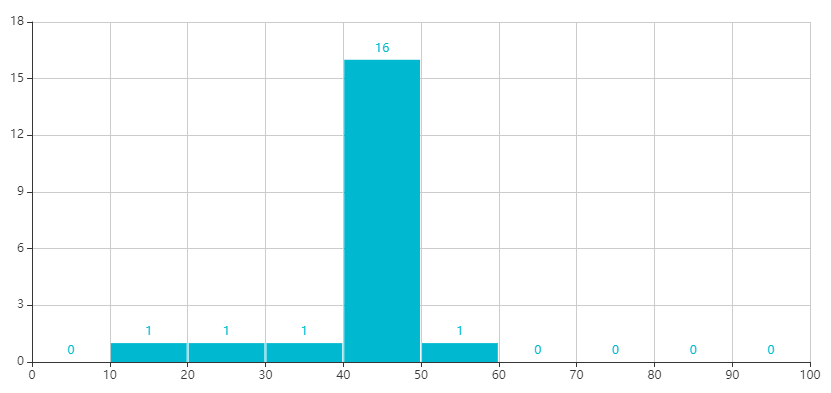
<div id="main1" style="width: 1000px;height: 500px"></div>
<script type="text/javascript">
 $(function(){
  generateChart();
 });
 function generateChart(){
  var myChart1 = echarts.init(document.getElementById('main1'));
  var girth = [19, 26.4, 34, 41.4, 42.4, 42.7, 42.9, 43.1, 43.2, 43.3, 43.3, 43.3, 44.9, 45.4, 46.2, 46.7, 48, 48, 49.1, 54.2];
  //自定义拼装数据方式
     var edata = new Array();
  var scopeMin = 0;
  var scopeMax = 100;
  var interval = (scopeMax-scopeMin)/10;
  var tmin = scopeMin;
  while(tmin < scopeMax){
   var x0 = tmin;
   var x1 = tmin+interval;
   var samplenum = 0;
   for(var i=0;i<girth.length;i++){
    if((scopeMin == x0 && girth[i] < x0) || (x0 <= girth[i] && x1 > girth[i])
     ||(scopeMin == x1 && girth[i] > x1)) {
     samplenum++;
    }
   }
   tmin += interval;
   edata.push([x0, x1, samplenum]);
  }
  var option = {
   color: ['rgb(25, 183, 207)'],
   grid: {
    top: 80,
    containLabel: true
   },
   xAxis: [{
    type: 'value',
    min: scopeMin,
    max: scopeMax,
    interval: interval
   }],
   yAxis: [{
    type: 'value',
   }],
   series: [{
    name: 'height',
    type: 'custom',
    renderItem: renderItem,
    label: {
     normal: {
      show: true,
      position: 'top'
     }
    },
    encode: {
     x: [0, 1],
     y: 2,
     tooltip: 2,
     label: 2
    },
    // data: data
    data: edata
   }]
  };
  myChart1.setOption(option);
  window.onresize = function () {
   myChart1.resize();
  }
 }
 function renderItem(params, api) {
  var yValue = api.value(2);
  var start = api.coord([api.value(0), yValue]);
  var size = api.size([api.value(1) - api.value(0), yValue]);
  var style = api.style();
  return {
   type: 'rect',
   shape: {
    x: start[0] + 1,
    y: start[1],
    width: size[0] - 2,
    height: size[1]
   },
   style: style
  };
 }
</script>
总结
总结
以上介绍了利用ECharts统计X轴区间数值的实例代码详解,希望能对大家有所帮助。如果有任何疑问,欢迎留言,小编会及时回复。