

本文介绍ECharts饼图中labelLine引导线长度自适应的设置方法。通过利用labelLayout回调函数,获取标签位置与中心点坐标,动态计算并调整引导线端点坐标,实现标签在左右两侧时引导线长度的自动适配,优化图表展示效果。
核心思路在于计算图表中心点坐标,并根据标签所在方位(左侧或右侧)调整引导线长度。若标签位于左侧,则从中心点坐标减去标签宽度及额外偏移量(如50像素);若位于右侧,则加上相应数值,从而根据图表实际尺寸动态适配引导线长度。
labelLayout配置项用于统一调整系列中所有标签的布局,包括(x, y)坐标、对齐方式等属性,旨在实现预期的标签排版效果,覆盖默认布局设置。
labelLayout回调函数机制
该配置项支持接收一个回调函数作为参数,函数内部可获取更详细的上下文信息以进行精确计算。
// 标签对应数据的 dataIndex
dataIndex: number
// 标签对应的数据类型,只在关系图中会有 node 和 edge 数据类型的区分
dataType?: string
// 标签对应的系列的 index
seriesIndex: number
// 标签显示的文本
text: string
// 默认的标签的包围盒,由系列默认的标签布局决定
labelRect: {x: number, y: number, width: number, height: number}
// 默认的标签水平对齐
align: 'left' | 'center' | 'right'
// 默认的标签垂直对齐
verticalAlign: 'top' | 'middle' | 'bottom'
// 标签所对应的数据图形的包围盒,可用于定位标签位置
rect: {x: number, y: number, width: number, height: number}
// 默认引导线的位置,目前只有饼图(pie)和漏斗图(funnel)有默认标签位置
// 如果没有该值则为 null
labelLinePoints?: number[][]
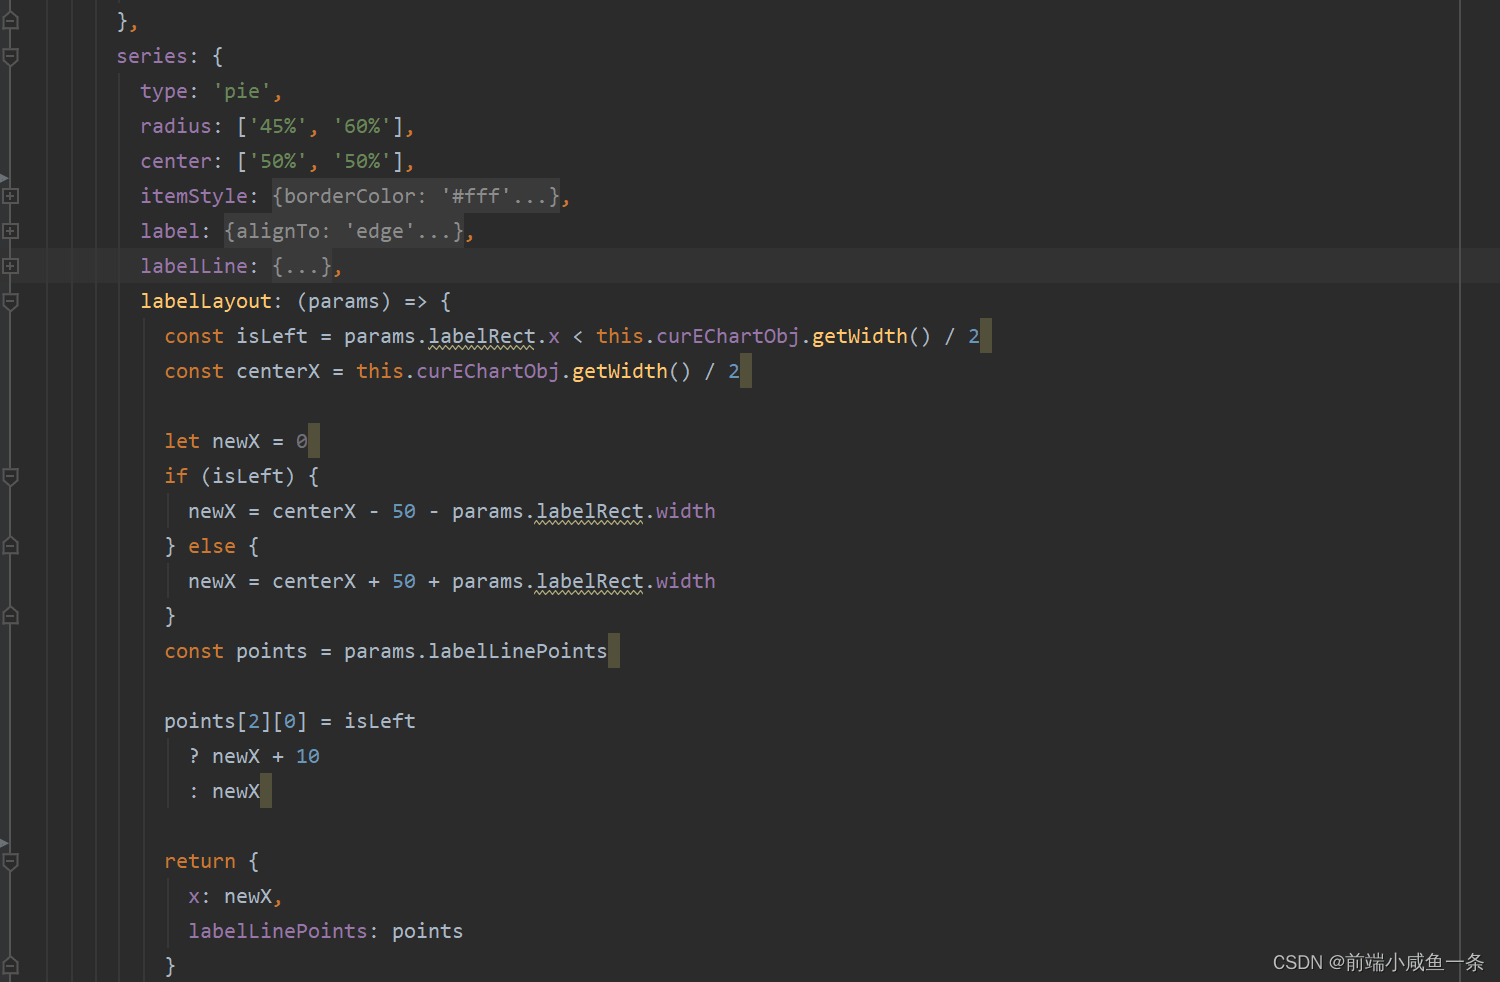
具体实现代码示例如下:
自适应引导线代码实现
  labelLayout: (params) => {
            const isLeft = params.labelRect.x < this.curEChartObj.getWidth() / 2
            const centerX = this.curEChartObj.getWidth() / 2
            let newX = 0
            if (isLeft) {
              newX = centerX - 50 - params.labelRect.width
            } else {
              newX = centerX + 50 + params.labelRect.width
            }
            const points = params.labelLinePoints
            points[2][0] = isLeft
              ? newX + 10
              : newX
            return {
              x: newX,
              labelLinePoints: points
            }
          },
完整的配置代码如下:
完整配置示例
const option = {
        color: ['#94b6f3', '#5087ec', '#b9cff7'],
        legend: {
          show: false
        },
        grid: {
          top: '1px',
          right: '1px',
          bottom: '1px',
          left: '2px'
        },
        series: {
          type: 'pie',
          radius: ['45%', '60%'],
          center: ['50%', '50%'],
          itemStyle: {
            borderColor: '#fff',
            borderWidth: 1
          },
          label: {
            alignTo: 'edge',
            formatter: '{name|{b}}\n{time|{c}人}',
            minMargin: 5,
            edgeDistance: 10,
            lineHeight: 15,
            width: 58,
            padding: [0, 6, 0, 10], // 关键代码!关键代码!关键代码!
            rich: {
              name: {
                align: 'left'
              },
              time: {
                fontSize: 12,
                color: '#333',
                align: 'left'
              }
            }
          },
          labelLine: {
            length: 15,
            length2: 0,
            maxSurfaceAngle: 80
          },
          labelLayout: (params) => {
            const isLeft = params.labelRect.x < this.curEChartObj.getWidth() / 2
            const centerX = this.curEChartObj.getWidth() / 2
            let newX = 0
            if (isLeft) {
              newX = centerX - 50 - params.labelRect.width
            } else {
              newX = centerX + 50 + params.labelRect.width
            }
            const points = params.labelLinePoints
            points[2][0] = isLeft
              ? newX + 10
              : newX
            return {
              x: newX,
              labelLinePoints: points
            }
          },
          data: pieData
        }
      }
总结
至此,关于ECharts饼图labelLine引导线长度自适应设置的讲解完毕。如需了解更多相关技巧,可查阅本站历史文章或继续浏览后续内容,感谢支持。