

本文深入解析JointJS开源JavaScript流程图框架,涵盖其核心特性如实时渲染、SVG可编程渲染及JSON序列化。通过Hello World示例展示基础用法,并详解如何利用Dagre插件实现自动布局。此外,文章探讨了前后端分离架构下的应用,演示了Node.js后端生成图形JSON数据并由前端解析渲染的完整流程,以及通过HTML定制元素的技巧。
JointJS框架概述
JointJS:JavaScript 流程图绘制框架
近期对用于绘制流程图的JavaScript框架进行了调研,最终选定JointJS。结合Dagre插件,能够生成结构清晰的流程图。
JointJS 简介
JointJS是一个开源的前端框架,支持绘制各类流程图和工作流图。其商业版Rappid提供了更多高级插件。根据官网介绍,JointJS具备以下主要特性:
- 能够实时渲染数百甚至上千个元素及连接线
- 支持多种图形元素,包括矩形、圆形、文本、图像和路径等
- 高度事件驱动,允许用户自定义Paper层下的各类事件响应
- 元素间的连接操作简便
- 支持高度定制的连接线和关系图样式
- 连接线平滑,采用贝塞尔插值算法并具备智能路径选择功能
- 基于SVG的可定制、可编程图形渲染引擎
- 支持Node.js环境
- 支持通过JSON格式进行序列化和反序列化操作
总体而言,JointJS是一款功能强大的流程图制作框架,其开源版本已足以满足日常开发需求。
一些常用地址:
API文档: https://resources.jointjs.com/docs/jointjs/v1.1/joint.html
教程资源: https://resources.jointjs.com/tutorial
基础示例:Hello World
JointJS Hello world
<!DOCTYPE html>
<html>
<head>
  <link rel="stylesheet" type="text/css" href="https://cdnjs.cloudflare.com/ajax/libs/jointjs/2.1.0/joint.css" rel="external nofollow" rel="external nofollow" rel="external nofollow" />
</head>
<body>
  <!-- content -->
  <div id="myholder"></div>
  <!-- dependencies 通过CDN加载依赖-->
  <script src="https://cdnjs.cloudflare.com/ajax/libs/jquery/3.1.1/jquery.js"></script>
  <script src="https://cdnjs.cloudflare.com/ajax/libs/lodash.js/3.10.1/lodash.js"></script>
  <script src="https://cdnjs.cloudflare.com/ajax/libs/backbone.js/1.3.3/backbone.js"></script>
  <script src="https://cdnjs.cloudflare.com/ajax/libs/jointjs/2.1.0/joint.js"></script>
  <!-- code -->
  <script type="text/javascript">
    var graph = new joint.dia.Graph;
    var paper = new joint.dia.Paper({
      el: document.getElementById('myholder'),
      model: graph,
      width: 600,
      height: 100,
      gridSize: 1
    });
    var rect = new joint.shapes.standard.Rectangle();
    rect.position(100, 30);
    rect.resize(100, 40);
    rect.attr({
      body: {
        fill: 'blue'
      },
      label: {
        text: 'Hello',
        fill: 'white'
      }
    });
    rect.addTo(graph);

    var rect2 = rect.clone();
    rect2.translate(300, 0);
    rect2.attr('label/text', 'World!');
    rect2.addTo(graph);
    var link = new joint.shapes.standard.Link();
    link.source(rect);
    link.target(rect2);
    link.addTo(graph);
  </script>
</body>
</html>
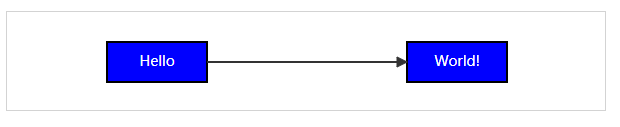
上述Hello World示例代码直观易懂。需要注意的是,图中的图形并未自动排版,而是通过手动移动第二个矩形(rect)来调整位置。
前后端分离架构应用
前后端分离架构
鉴于JointJS支持Node.js,可以将繁重的图形绘制任务移至服务器端处理,随后通过JSON序列化将图形对象通过HTTP传输,从而减轻客户端的计算压力。
NodeJS 后端
var express = require('express');
var joint = require('jointjs');

var app = express();

function get_graph(){
  var graph = new joint.dia.Graph();

  var rect = new joint.shapes.standard.Rectangle();
  rect.position(100, 30);
  rect.resize(100, 40);
  rect.attr({
    body: {
      fill: 'blue'
    },
    label: {
      text: 'Hello',
      fill: 'white'
    }
  });
  rect.addTo(graph);

  var rect2 = rect.clone();
  rect2.translate(300, 0);
  rect2.attr('label/text', 'World!');
  rect2.addTo(graph);

  var link = new joint.shapes.standard.Link();
  link.source(rect);
  link.target(rect2);
  link.addTo(graph);

  return graph.toJSON();
}

app.all('*', function(req, res, next) {
  res.header("Access-Control-Allow-Origin", "*");
  res.header("Access-Control-Allow-Headers", "X-Requested-With");
  res.header("Access-Control-Allow-Methods","PUT,POST,GET,DELETE,OPTIONS");
  next();
});

app.get('/graph', function(req, res){
  console.log('[+] send graph json to client')
  res.send(get_graph());
});
app.listen(8071);
HTML 前端
<!DOCTYPE html>
<html>
<head>
  <link rel="stylesheet" type="text/css" href="https://cdnjs.cloudflare.com/ajax/libs/jointjs/2.1.0/joint.css" rel="external nofollow" rel="external nofollow" rel="external nofollow" />
</head>
<body>
  <!-- content -->
  <div id="myholder"></div>

  <!-- dependencies 通过CDN加载依赖-->
  <script src="https://cdnjs.cloudflare.com/ajax/libs/jquery/3.1.1/jquery.js"></script>
  <script src="https://cdnjs.cloudflare.com/ajax/libs/lodash.js/3.10.1/lodash.js"></script>
  <script src="https://cdnjs.cloudflare.com/ajax/libs/backbone.js/1.3.3/backbone.js"></script>
  <script src="https://cdnjs.cloudflare.com/ajax/libs/jointjs/2.1.0/joint.js"></script>

  <!-- code -->
  <script type="text/javascript">
    var graph = new joint.dia.Graph;
    var paper = new joint.dia.Paper({
      el: document.getElementById('myholder'),
      model: graph,
      width: 600,
      height: 100,
      gridSize: 1
    });

    $.get('http://192.168.237.128:8071/graph', function(data, statue){
      graph.fromJSON(data);
    });
  </script>
</body>
</html>
其他
自动布局实现
自动布局 Automatic layout
JointJS内置了自动排版插件,其原理是调用Dagre库。官方API中提供了相关示例。
使用方法:
var graphBBox = joint.layout.DirectedGraph.layout(graph, {
nodeSep: 50,
edgeSep: 80,
rankDir: "TB"
});
| 配置参数 | 注释 |
|---|---|
| nodeSep | 相同rank的邻接节点的距离 |
| edgeSep | 相同rank的邻接边的距离 |
| rankSep | 不同 rank 元素之间的距离 |
| rankDir | 布局方向 ( "TB" (top-to-bottom) / "BT" (bottom-to-top) / "LR" (left-to-right) / "RL"(right-to-left)) |
| marginX | number of pixels to use as a margin around the left and right of the graph. |
| marginY | number of pixels to use as a margin around the top and bottom of the graph. |
| ranker | 排序算法。 Possible values: 'network-simplex' (default), 'tight-tree' or 'longest-path'. |
| resizeClusters | set to false if you don't want parent elements to stretch in order to fit all their embedded children. Default is true. |
| clusterPadding | A gap between the parent element and the boundary of its embedded children. It could be a number or an object e.g. { left: 10, right: 10, top: 30, bottom: 10 }. It defaults to 10. |
| setPosition(element, position) | a function that will be used to set the position of elements at the end of the layout. This is useful if you don't want to use the default element.set('position', position) but want to set the position in an animated fashion via transitions. |
| setVertices(link, vertices) | If set to true the layout will adjust the links by setting their vertices. It defaults to false. If the option is defined as a function it will be used to set the vertices of links at the end of the layout. This is useful if you don't want to use the default link.set('vertices', vertices) but want to set the vertices in an animated fashion via transitions. |
| setLabels(link, labelPosition, points) | If set to true the layout will adjust the labels by setting their position. It defaults to false. If the option is defined as a function it will be used to set the labels of links at the end of the layout. Note: Only the first label (link.label(0);) is positioned by the layout. |
| dagre | 默认情况下,dagre 应该在全局命名空间当中,不过你也可以当作参数传进去 |
| graphlib | 默认情况下,graphlib 应该在全局命名空间当中,不过你也可以当作参数传进去 |
我们来试一下。NodeJS 后端
var express = require('express');
var joint = require('jointjs');
var dagre = require('dagre')
var graphlib = require('graphlib');
var app = express();
function get_graph(){
  var graph = new joint.dia.Graph();
  var rect = new joint.shapes.standard.Rectangle();
  rect.position(100, 30);
  rect.resize(100, 40);
  rect.attr({
    body: {
      fill: 'blue'
    },
    label: {
      text: 'Hello',
      fill: 'white'
    }
  });
  rect.addTo(graph);
  var rect2 = rect.clone();
  rect2.translate(300, 0);
  rect2.attr('label/text', 'World!');
  rect2.addTo(graph);
  for(var i=0; i<10; i++){
    var cir = new joint.shapes.standard.Circle();
    cir.resize(100, 100);
    cir.position(10, 10);
    cir.attr('root/title', 'joint.shapes.standard.Circle');
    cir.attr('label/text', 'Circle' + i);
    cir.attr('body/fill', 'lightblue');
    cir.addTo(graph);
    var ln = new joint.shapes.standard.Link();
    ln.source(cir);
    ln.target(rect2);
    ln.addTo(graph);
  }
  var link = new joint.shapes.standard.Link();
  link.source(rect);
  link.target(rect2);
  link.addTo(graph);
  //auto layout
  joint.layout.DirectedGraph.layout(graph, {
    nodeSep: 50,
    edgeSep: 50,
    rankDir: "TB",
    dagre: dagre,
    graphlib: graphlib
  });
  return graph.toJSON();
}
app.all('*', function(req, res, next) {
  res.header("Access-Control-Allow-Origin", "*");
  res.header("Access-Control-Allow-Headers", "X-Requested-With");
  res.header("Access-Control-Allow-Methods","PUT,POST,GET,DELETE,OPTIONS");
  next();
});
app.get('/graph', function(req, res){
  console.log('[+] send graph json to client')
  res.send(get_graph());
});
app.listen(8071);
HTML 前端
<!DOCTYPE html>
<html>
<head>
  <link rel="stylesheet" type="text/css" href="https://cdnjs.cloudflare.com/ajax/libs/jointjs/2.1.0/joint.css" rel="external nofollow" rel="external nofollow" rel="external nofollow" />
</head>
<body>
  <!-- content -->
  <div id="myholder"></div>

  <!-- dependencies 通过CDN加载依赖-->
  <script src="https://cdnjs.cloudflare.com/ajax/libs/jquery/3.1.1/jquery.js"></script>
  <script src="https://cdnjs.cloudflare.com/ajax/libs/lodash.js/3.10.1/lodash.js"></script>
  <script src="https://cdnjs.cloudflare.com/ajax/libs/backbone.js/1.3.3/backbone.js"></script>
  <script src="https://cdnjs.cloudflare.com/ajax/libs/jointjs/2.1.0/joint.js"></script>

  <!-- code -->
  <script type="text/javascript">
    var graph = new joint.dia.Graph;
    var paper = new joint.dia.Paper({
      el: document.getElementById('myholder'),
      model: graph,
      width: 2000,
      height: 2000,
      gridSize: 1
    });
    $.get('http://192.168.237.128:8071/graph', function(data, statue){
      graph.fromJSON(data);
    });
  </script>
</body>
</html>
结果:

HTML元素定制
使用 HTML 定制元素
流程图中的每个节点(即元素)均可自定义,直接编写HTML代码即可添加按钮、输入框、代码块等组件。
我编写了一个代码块Demo,配合highlight.js可以达到类似IDA控制流图的效果。这一功能具有很高的可玩性。
joint.shapes.BBL = {};
joint.shapes.BBL.Element = joint.shapes.basic.Rect.extend({
  defaults: joint.util.deepSupplement({
    type: 'BBL.Element',
    attrs: {
      rect: { stroke: 'none', 'fill-opacity': 0 }
    }
  }, joint.shapes.basic.Rect.prototype.defaults)
});

// Create a custom view for that element that displays an HTML div above it.
// -------------------------------------------------------------------------
joint.shapes.BBL.ElementView = joint.dia.ElementView.extend({
  template: [
    '<div class="html-element" data-collapse>',
    '<label></label><br/>',
    '<div class="hljs"><pre><code></code></pre></span></div>',
    '</div>'
  ].join(''),

  initialize: function() {
    _.bindAll(this, 'updateBox');
    joint.dia.ElementView.prototype.initialize.apply(this, arguments);

    this.$box = $(_.template(this.template)());
    // Prevent paper from handling pointerdown.
    this.$box.find('h3').on('mousedown click', function(evt) {
      evt.stopPropagation();
    });

    // Update the box position whenever the underlying model changes.
    this.model.on('change', this.updateBox, this);
    // Remove the box when the model gets removed from the graph.
    this.model.on('remove', this.removeBox, this);

    this.updateBox();
  },
  render: function() {
    joint.dia.ElementView.prototype.render.apply(this, arguments);
    this.paper.$el.prepend(this.$box);
    this.updateBox();
    return this;
  },
  updateBox: function() {
  // Set the position and dimension of the box so that it covers the JointJS element.
    var bbox = this.model.getBBox();
    // Example of updating the HTML with a data stored in the cell model.
    this.$box.find('label').text(this.model.get('label'));
    this.$box.find('code').html(this.model.get('code'));
    var color = this.model.get('color');
    this.$box.css({
      width: bbox.width,
      height: bbox.height,
      left: bbox.x,
      top: bbox.y,
      background: color,
      "border-color": color
    });
  },
  removeBox: function(evt) {
    this.$box.remove();
  }
});
以上就是本文的全部内容,希望对大家的学习有所帮助,也希望大家多多支持本站。