

本教程详细介绍如何利用D3.js与Pusher Channels构建实时更新的交互式数据可视化应用。内容涵盖从环境配置、服务器端搭建到前端图表渲染及实时数据推送的完整流程,帮助开发者掌握动态图形生成与WebSocket通信的核心技术。
D3.js与Pusher Channels实现实时数据可视化教程
首先,确保您的计算机已安装Node.js和npm环境。
数据可视化是传递复杂信息的高效方式,D3.js为此提供了强大的工具集与极高的灵活性。
D3.js是一个基于JavaScript的库,旨在利用SVG、HTML和CSS在Web浏览器中生成动态且交互式的数据可视化内容。
D3提供了多种简单易用的函数,显著降低了JavaScript操作数据的难度。尽管纯JavaScript也能实现所有功能,但D3能大幅减少工作量,特别是在数据可视化领域。它将生成可视化的复杂步骤精简为几个简单函数,只需输入少量数据即可转换为丰富的图形。具备JavaScript基础的用户可以轻松上手。
本教程将探讨如何结合D3.js与Pusher Channels构建实时图形。如需参考完整代码,请查阅相关的GitHub存储库。
准备工作
准备工作
完成本教程需安装Node.js和npm。以下为本教程创建时使用的版本信息:
- Node.js v10.4.1
- npm v6.3.0
此外,您还需在计算机上安装http-server,可通过执行npm install http-server命令进行安装。
虽然无需具备Pusher使用经验,但熟悉该技术将有助于更好地理解JavaScript和D3.js的应用。
开始构建
开始构建
首先,为应用程序创建一个新目录,可命名为“实时图形”或您喜欢的名称。在新目录中创建index.html文件,并粘贴以下代码:
//index.html

  <!DOCTYPE html>
  <hml lang="en">
  <head>
   <meta charset="UTF-8">
   <meta name="viewport" content="width=device-width, initial-scale=1.0">
   <meta http-equiv="X-UA-Compatible" content="ie=edge">
   <link rel="stylesheet" href="style.css" rel="external nofollow" >
   <title>Realtime D3 Chart</title>
  </head>
  <body>

   <script src="https://js.pusher.com/4.2/pusher.min.js"></script>
   <script src="https://d3js.org/d3.v5.min.js"></script>
   <script src="app.js"></script>
  </body>
  </html>
如代码所示,HTML文件仅引入构建图形所需的样式和脚本。我们利用D3.js构建图表,并通过Pusher实现实时功能。app.js文件用于编写前端应用代码。
在实现图表逻辑前,先在style.css中定义应用样式:
 // style.css

  html {
   height: 100%;
   box-sizing: border-box;
   padding: 0;
   margin: 0;
  }

  *, *::before, *::after {
   box-sizing: inherit;
  }

  body {
   height: 100%;
   font-family: -apple-system, BlinkMacSystemFont, "Segoe UI", Roboto, Oxygen-Sans, Ubuntu, Cantarell, "Helvetica Neue", sans-serif;
   overflow: hidden;
   background: linear-gradient(135deg, #ffffff 0%,#e8f1f5 100%);
  }

  .container {
   position: absolute;
   padding: 20px;
   top: 50%;
   left: 50%;
   background-color: white;
   border-radius: 4px;
   transform: translate(-50%, -50%);
   box-shadow: 0px 50px 100px 0px rgba(0,0,102,0.1);
   text-align: center;
  }

  .container h1 {
   color: #333;
  }

  .bar {
   fill: #6875ff;
   border-radius: 2px;
  }

  .bar:hover {
   fill: #1edede;
  }

  .tooltip {
   opacity: 0;
   background-color: rgb(170, 204, 247);
   padding: 5px;
   border-radius: 4px;
   transition: opacity 0.2s ease;
  }
安装服务器依赖项
安装服务器依赖项
假设Node和npm已安装,请运行以下命令以安装服务器组件所需的所有依赖项:
npm install express dotenv cors pusherPusher配置
Pusher配置
访问Pusher网站并注册免费账户。在侧边栏选择“Channels apps”,点击“Create Channels app”创建新应用。
创建应用后,从“API Keys”选项卡获取凭据。在项目目录根目录创建variables.env文件,并添加以下内容:
// variables.env

  PUSHER_APP_ID=<your app id>
  PUSHER_APP_KEY=<your app key>
  PUSHER_APP_SECRET=<your app secret>
  PUSHER_APP_CLUSTER=<your app cluster>
服务器设置
服务器设置
依赖项已安装且Pusher账户配置完毕,现在开始构建服务器。
在项目根目录创建server.js文件,并粘贴以下代码:
// server.js

  require('dotenv').config({ path: 'variables.env' });
  const express = require('express');
  const cors = require('cors');

  const poll = [
   {
    name: 'Chelsea',
    votes: 100,
   },
   {
    name: 'Arsenal',
    votes: 70,
   },
   {
    name: 'Liverpool',
    votes: 250,
   },
   {
    name: 'Manchester City',
    votes: 689,
   },
   {
    name: 'Manchester United',
    votes: 150,
   },
  ];

  const app = express();
  app.use(cors());

  app.get('/poll', (req, res) => {
   res.json(poll);
  });

  app.set('port', process.env.PORT || 4000);
  const server = app.listen(app.get('port'), () => {
   console.log(Express running → PORT ${server.address().port});
  });
保存文件后,从项目根目录运行node server.js以启动服务器。
前端应用设置
前端应用设置
前端代码将编写在之前提到的app.js文件中。在项目根目录创建此文件,并粘贴以下代码:
// app.js

  // set the dimensions and margins of the graph
  const margin = { top: 20, right: 20, bottom: 30, left: 40 };
  const width = 960 - margin.left - margin.right;
  const height = 500 - margin.top - margin.bottom;

  // set the ranges for the graph
  const x = d3
   .scaleBand()
   .range([0, width])
   .padding(0.1);

  const y = d3.scaleLinear().range([height, 0]);

  // append the container for the graph to the page
  const container = d3
   .select('body')
   .append('div')
   .attr('class', 'container');

  container.append('h1').text('Who will win the 2018/19 Premier League Season?');

  // append the svg object to the body of the page
  // append a 'group' element to 'svg'
  // moves the 'group' element to the top left margin
  const svg = container
   .append('svg')
   .attr('width', width + margin.left + margin.right)
   .attr('height', height + margin.top + margin.bottom)
   .append('g')
   .attr('transform', 'translate(' + margin.left + ',' + margin.top + ')');

  // Create a skeleton structure for a tooltip and append it to the page
  const tip = d3
   .select('body')
   .append('div')
   .attr('class', 'tooltip');

  // Get the poll data from the /poll endpoint
  fetch('http://localhost:4000/poll')
   .then(response => response.json())
   .then(poll => {
    // add the x Axis
    svg
     .append('g')
     .attr('transform', 'translate(0,' + height + ')')
     .attr('class', 'x-axis')
     .call(d3.axisBottom(x));

    // add the y Axis
    svg
     .append('g')
     .attr('class', 'y-axis')
     .call(d3.axisLeft(y));

    update(poll);
   });

  function update(poll) {
   // Scale the range of the data in the x axis
   x.domain(
    poll.map(d => {
     return d.name;
    })
   );

   // Scale the range of the data in the y axis
   y.domain([
    0,
    d3.max(poll, d => {
     return d.votes + 200;
    }),
   ]);

   // Select all bars on the graph, take them out, and exit the previous data set.
   // Enter the new data and append the rectangles for each object in the poll array
   svg
    .selectAll('.bar')
    .remove()
    .exit()
    .data(poll)
    .enter()
    .append('rect')
    .attr('class', 'bar')
    .attr('x', d => {
     return x(d.name);
    })
    .attr('width', x.bandwidth())
    .attr('y', d => {
     return y(d.votes);
    })
    .attr('height', d => {
     return height - y(d.votes);
    })
    .on('mousemove', d => {
     tip
      .style('position', 'absolute')
      .style('left', ${d3.event.pageX + 10}px)
      .style('top', ${d3.event.pageY + 20}px)
      .style('display', 'inline-block')
      .style('opacity', '0.9')
      .html(
       <div><strong>${d.name}</strong></div> <span>${d.votes} votes</span>
      );
    })
    .on('mouseout', () => tip.style('display', 'none'));

   // update the x-axis
   svg.select('.x-axis').call(d3.axisBottom(x));

   // update the y-axis
   svg.select('.y-axis').call(d3.axisLeft(y));
  }
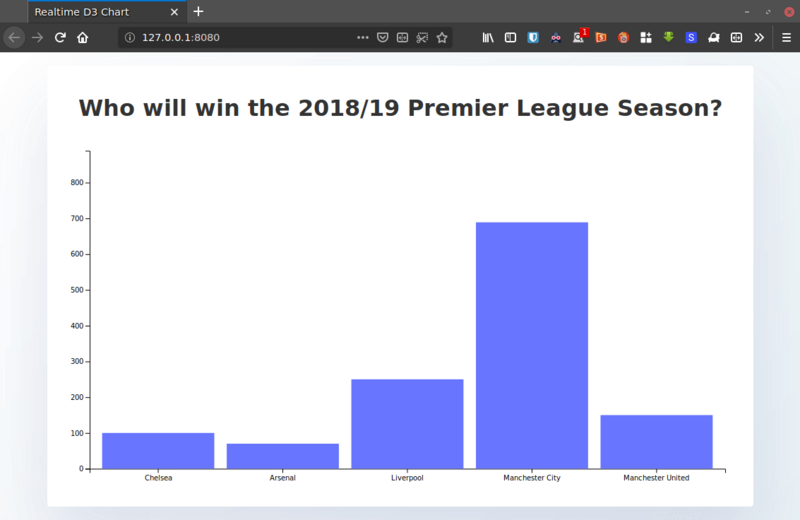
上述代码块中,我们利用通过/poll端点接收的初始数据创建了一个基础条形图。熟悉D3工作原理的用户应能理解这些代码。关键部分已添加注释以指导图表构建过程。
在另一个终端中,启动开发服务器以提供index.html文件:
npx http-server此处使用http-server,您也可以使用其他服务器,甚至可以直接在浏览器中打开index.html文件。
此时,您的图表应显示如下:
利用Pusher实时更新图表
利用Pusher实时更新图表
为确保轮询更新能实时反映在前端应用中,请将以下代码粘贴到app.js文件末尾:
 // app.js

  const pusher = new Pusher('<your app key>', {
   cluster: '<your app cluster>',
   encrypted: true,
  });

  const channel = pusher.subscribe('poll-channel');
  channel.bind('update-poll', data => {
   update(data.poll);
  });
在此处,我们建立了与Channels的连接,并使用Pusher的subscribe()方法订阅名为“poll-channel”的新频道。通过bind方法监听轮询更新,并在收到更新后调用update()函数,使用最新数据重新渲染图形。
请务必使用Pusher账户信息中心中的对应详细信息替换代码中的占位符。
从服务器触发更新
从服务器触发更新
我们将模拟每秒更新一次的轮询,并在数据变化时使用Pusher触发更新,使订阅者(客户端)能实时接收数据。
在server.js的其他导入下方添加以下代码:
 const Pusher = require('pusher');

  const pusher = new Pusher({
   appId: process.env.PUSHER_APP_ID,
   key: process.env.PUSHER_APP_KEY,
   secret: process.env.PUSHER_APP_SECRET,
   cluster: process.env.PUSHER_APP_CLUSTER,
   encrypted: true,
  });

  function getRandomNumber(min, max) {
   return Math.floor(Math.random() * (max - min) + min);
  }

  function increment() {
   const num = getRandomNumber(0, poll.length);
   poll[num].votes += 20;
  }

  function updatePoll() {
   setInterval(() => {
    increment();
    pusher.trigger('poll-channel', 'update-poll', {
     poll,
    });
   }, 1000);
  }
随后将/poll端点修改为如下形式:
 app.get('/poll', (req, res) => {
   res.json(poll);
   updatePoll();
  });
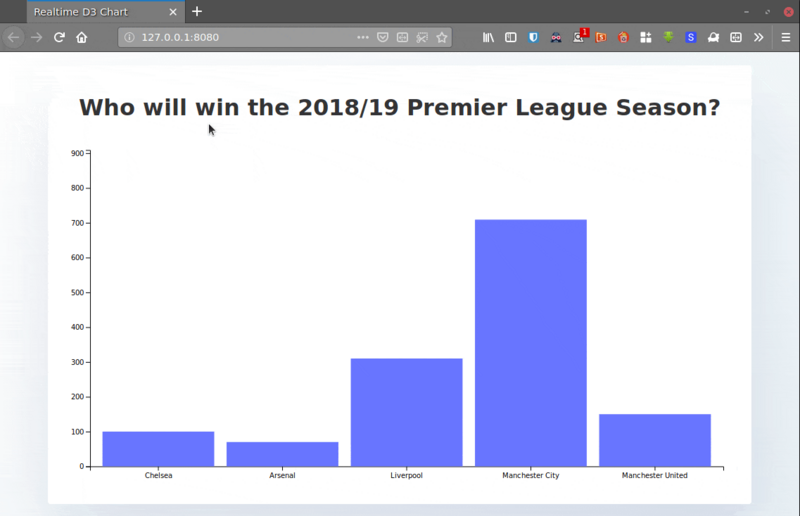
/poll路由将初始轮询数据发送给客户端,并调用updatePoll()函数。该函数以三秒为间隔递增随机俱乐部的投票数,并触发我们在上一步客户端创建的轮询频道更新。
通过从项目根目录运行node server.js,重启服务器。此时,您应能看到实时更新的条形图。
总结
总结
您已了解使用D3.js创建条形图的过程,以及如何利用Pusher Channels实现实时条形图更新。
我们为Pusher和D3提供了一个简单用例,但这仅是初步探索。建议深入研究官方文档,了解更多关于Pusher及其他功能的信息。
感谢阅读!您可以在GitHub存储库中找到本教程的完整源代码。希望这对您的学习有所帮助,也欢迎大家支持本站。