

本文介绍如何在 ECharts 的 tooltip 中展示多项自定义数据。通过配置 formatter 函数,可以获取 params 数组中的每个数据项信息,并提取 value 及自定义字段,结合 HTML 模板实现多数据列的自定义渲染效果。
效果如图
当鼠标悬停在某个柱状图上时,会显示该项数据的多个自定义信息,并应用自定义的模板样式进行渲染。
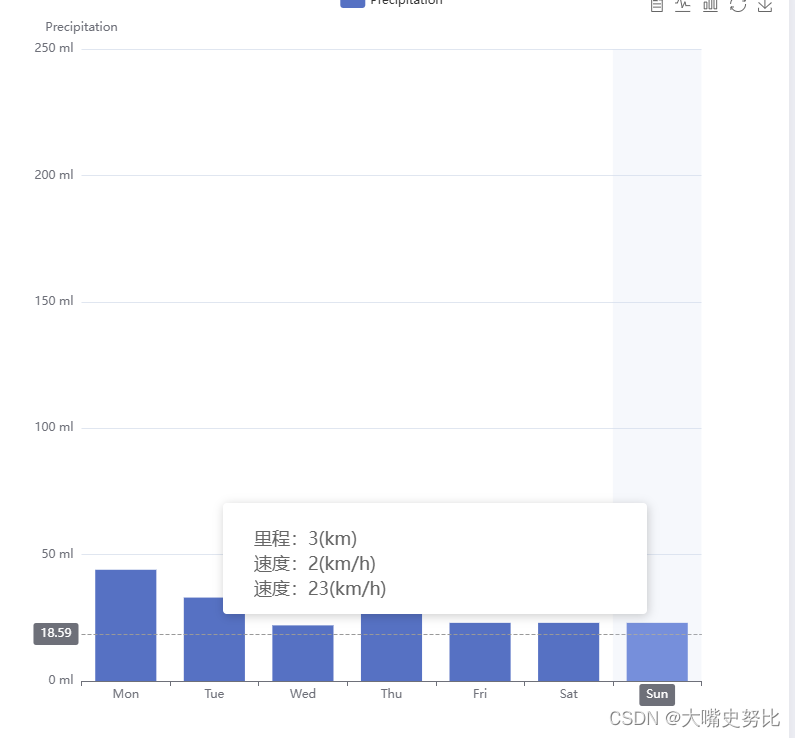
目标是展示每一列中包含的多个自定义数据字段。
代码部分
主要配置在 data 数据中,其中 value 代表实际展示的主数据,其他字段名则对应自定义的数据内容。
option = {
  tooltip: {
    trigger: 'axis',
    axisPointer: {
      type: 'cross',
      crossStyle: {
        color: '#999'
      }
    },
    formatter: function(params) {
              // params 是一个数组,包含了每个数据项的信息
              var result = `<div style="width: 402px;font-family: PingFang SC, PingFang SC-Regular;backdrop-filter: blur(20px);">
                <div class="top" style="margin-top:14px;margin-left:20px">
                  <div class="tl" style="width: 50px;font-size: 18px;margin-bottom: 4px;margin-right: 200px;">里程:${params[0].data.b}(km)</div>
                  <div class="tr" style="width: 50px;font-size: 18px;margin-bottom: 4px;">速度:${params[0].data.a}(km/h)</div>
                  <div class="tr" style="width: 50px;font-size: 18px;margin-bottom: 4px;">速度:${params[0].data.value}(km/h)</div>
                </div>
              </div>`;
              return result;
            },
  },
  toolbox: {
    feature: {
      dataView: { show: true, readOnly: false },
      magicType: { show: true, type: ['line', 'bar'] },
      restore: { show: true },
      saveAsImage: { show: true }
    }
  },
  legend: {
    data: ['Precipitation', 'Temperature']
  },
  xAxis: [
    {
      type: 'category',
      data: ['Mon', 'Tue', 'Wed', 'Thu', 'Fri', 'Sat', 'Sun'],
      axisPointer: {
        type: 'shadow'
      }
    }
  ],
  yAxis: [
    {
      type: 'value',
      name: 'Precipitation',
      min: 0,
      max: 250,
      interval: 50,
      axisLabel: {
        formatter: '{value} ml'
      }
    },
  ],
  series: [
    {
      name: 'Precipitation',
      type: 'bar',
      tooltip: {
        valueFormatter: function (value) {
          return value + ' ml';
        }
      },
      data: [
      {value:44, a:2, b:3},{value:33, a:2, b:3},{value:22, a:2, b:3},{value:66, a:2, b:3},{value:23, a:2, b:3},{value:23, a:2, b:3},{value:23, a:2, b:3}
      ],
    },
  ]
};
总结
到此这篇关于前端 ECharts tooltip 展示多项自定义数据的文章就介绍到这了,更多相关 ECharts tooltip 多项自定义数据内容请搜索本站以前的文章或继续浏览下面的相关文章希望大家以后多多支持本站!