

本文详细介绍JavaScript多功能甘特图组件jsGantt的核心功能与使用方法。该组件支持多语言、任务分组、依赖关系可视化及动态数据加载,并兼容Angular、React等框架。文章涵盖从安装导入、实例化到数据解析、图表绘制及选项配置的全流程,帮助开发者快速集成高效的项目管理视图。
更多特点
多语言支持: 使甘特图具备全球多语言环境下的适用性。
任务和可折叠的任务组: 支持以结构化方式构建任务,并允许用户轻松展开或折叠浏览。
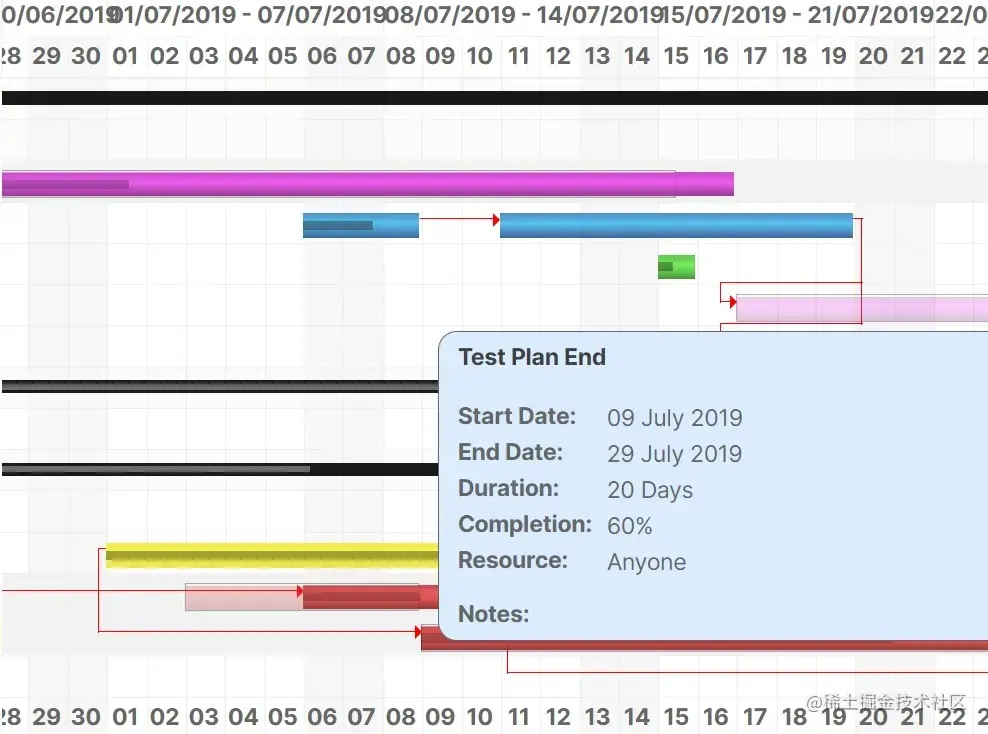
依赖关系和突出显示: 可视化展示任务间的依赖逻辑,并通过悬停操作快速查看任务详细信息。
数据可编辑性: 支持通过内嵌的责任方列表实时更新甘特表内容。
附加列: 允许添加额外列以丰富甘特表的数据展示维度。
动态加载和格式变化: 支持动态加载任务数据,并可在小时、日、周、月和季度等多种时间格式间自由切换。
远程或本地数据: 支持从本地JS对象或远程JSON/XML数据源获取并渲染甘特图数据。
也可与Angular、React、Vue和.Net合作
如何使用它
1.安装并导入jsGantt。
# NPM
$ npm i jsgantt-improved
import {JSGantt} from 'jsgantt-improved';2.或者直接在文档中加载所需的JS/CSS文件。
<!-- OR -->
<link rel="stylesheet" href="dist/jsgantt.css" rel="external nofollow"  />
<script src="dist/jsgantt.js"></script>
3.创建一个空的容器来放置甘特图。
<div style="position:relative" class="gantt" id="example"></div>4.创建一个新的甘特图实例。
pDiv: 图表容器的选择器
pFormat: "小时"、"日"、"周"、"月 "或 "季度"
// JSGantt.GanttChart(pDiv, pFormat);
const myChart = new JSGantt.GanttChart(document.getElementById('GanttChartDIV'), 'day');
5.从JS对象、JS字符串、JSON或XML加载任务数据。
// object
myChart.AddTaskItemObject({
  pID: 1,
  pName: "Name 1",
  pStart: "2023-02-25",
  pEnd: "2023-03-17",
  pPlanStart: "2023-04-01",
  pPlanEnd: "2023-04-15 12:00",
  pClass: "",
  pPlanClass: ""
  pLink: "",
  pMile: 0,
  pRes: "Brian", // resource name
  pComp: 0,
  pGroup: 0, // 0 = normal task, 1 = standard group task, 2 = combined group task
  pParent: 0, // parent ID
  pOpen: 1, // 1 = open, 0 = closed
  pDepend: "", // comma separated list of ids this task is dependent on
  pCaption: "",
  pCost: 1000,
  pNotes: "Some Notes text",
  pBarText: "ex. bar text",
  category: "My Category",
  sector: "Finance"
});
// JSON
JSGantt.parseJSON('./data.json', myChart);// XML
JSGantt.parseXML("./data.xml", myChart);6.在页面上画出图表。
myChart.Draw();7.按ID删除一个任务项目。
myChart.RemoveTaskItem(5);8.清除所有任务。
myChart.ClearTasks()9.设置选项。
g.setOptions({
  vCaptionType: 'Complete',  // Set to Show Caption : None,Caption,Resource,Duration,Complete,
  vQuarterColWidth: 36,
  vDateTaskDisplayFormat: 'day dd month yyyy', // Shown in tooltip box
  vDayMajorDateDisplayFormat: 'mon yyyy - Week ww',// Set format to display dates in the "Major" header of the "Day" view
  vWeekMinorDateDisplayFormat: 'dd mon', // Set format to display dates in the "Minor" header of the "Week" view
  vLang: lang,
  vAdditionalHeaders: { // Add data columns to your table
    category: {
      title: 'Category'
    },
    sector: {
      title: 'Sector'
    }
  },
  vShowTaskInfoLink: 1, // Show link in tool tip (0/1)
  vShowEndWeekDate: 0,  // Show/Hide the date for the last day of the week in header for daily view (1/0)
  vUseSingleCell: 10000, // Set the threshold at which we will only use one cell per table row (0 disables).  Helps with rendering performance for large charts.
  vFormatArr: ['Day', 'Week', 'Month', 'Quarter'], // Even with setUseSingleCell using Hour format on such a large chart can cause issues in some browsers
  vScrollTo: new Date(),
  // EVENTS
  // OnChangee
  vEventsChange: {
    taskname: console.log,
    res: console.log,
  },
  // EventsClickCell
  vEvents: {
    taskname: console.log,
    res: console.log,
    dur: console.log,
    comp: console.log,
    start: console.log,
    end: console.log,
    planstart: console.log,
    planend: console.log,
    cost: console.log,
    additional_category: console.log, // for additional fields
    beforeDraw: ()=>console.log('before draw listener'),
    afterDraw: ()=>console.log('before after listener')
  },
  vEventClickRow: console.log,
  vEventClickCollapse: console.log
});
到此这篇关于JavaScript多功能甘特图组件jsGantt详解的文章就介绍到这了,更多相关JavaScript 甘特图组件jsGantt内容请搜索本站以前的文章或继续浏览下面的相关文章希望大家以后多多支持本站!