

本文介绍如何在OpenLayers中根据指定半径绘制三个圆形,并通过代码将三个圆心两两连接。重点讲解如何计算圆心间的距离并在地图上添加相应的距离标注,最终实现包含圆形、连线及距离信息的完整地图效果。
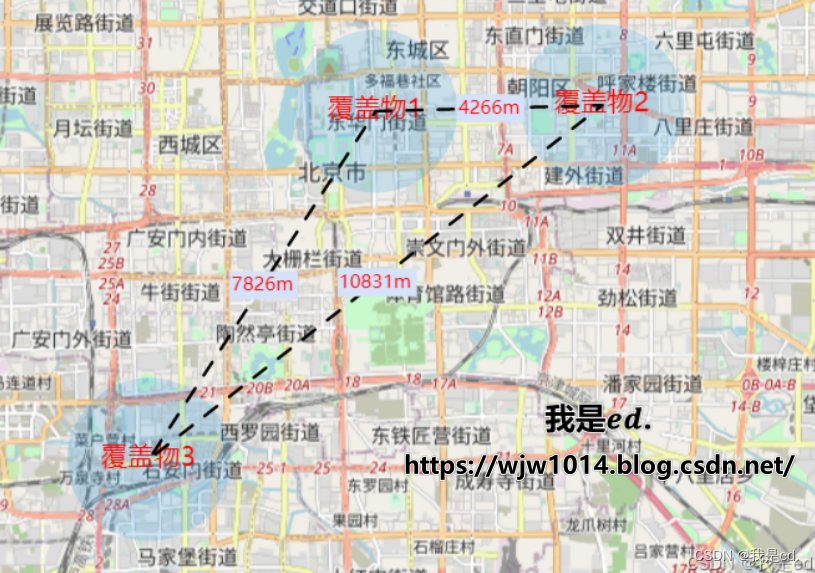
本文旨在展示如何在OpenLayers地图中实现特定功能:绘制三个圆形,并将这三个圆的圆心两两连接,同时标记出每两个圆心之间的具体距离。
期望效果
写在前面
该功能在OpenLayers中实现较为直观。此前已有相关博文介绍如何根据半径绘制圆形以及如何根据经纬度坐标绘制连线。因此,只需将这些现有功能进行组合拼接,即可实现今日的目标,无需从头编写复杂逻辑。
绘制圆形
关于OpenLayers的基础安装、导入及使用步骤,此处不再赘述。若对此不熟悉,可参考之前的相关博客文章。本文将直接切入核心实现部分。
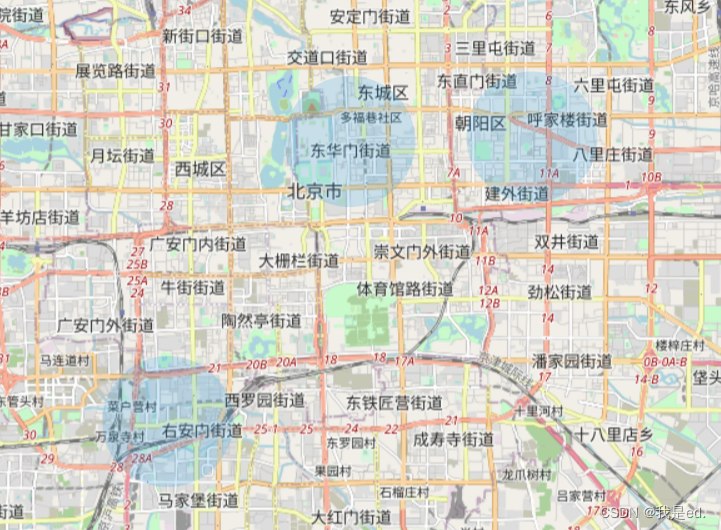
第一步,我们需要在地图上绘制三个蓝色的圆形。
以下是实现该功能的关键代码。需要特别说明的是,这里仅展示核心逻辑代码。若代码无法运行,通常是因为缺少基础变量创建(如地图实例、图层对象等),请根据报错信息自行补充必要的初始化代码,并对关键部分进行适当调整即可。
	  // 绘制圆
      addPoint() {
      	// 下面这个经纬度都是写死的哈,一会连线和标签都是一样的数据
        let sites = [{
          site: [116.400819, 39.916263],
          name: '覆盖物1'
        }, {
          site: [116.450819, 39.917263],
          name: '覆盖物2'
        }, {
          site: [116.350819, 39.857263],
          name: '覆盖物3'
        }]
        let features = []
        sites.forEach((item, index) => {
          let feature = new Feature({
            title: item.name,
            geometry: new Circle(fromLonLat(item.site), this.getRadius(2000)),
          })
          feature.setStyle(
            new Style({
              fill: new Fill({
                color: 'rgba(32, 157, 230, 1)'
              }),
            })
          )
          features.push(feature)
        })
        let source = new VectorSource()
        source.addFeatures(features)
        let layer = new VectorLayer({
          opacity: 0.2
        })
        layer.setSource(source)
        map.addLayer(layer)
      },
完成上述步骤并刷新页面后,应能看到如下所示的效果。
添加圆形标识
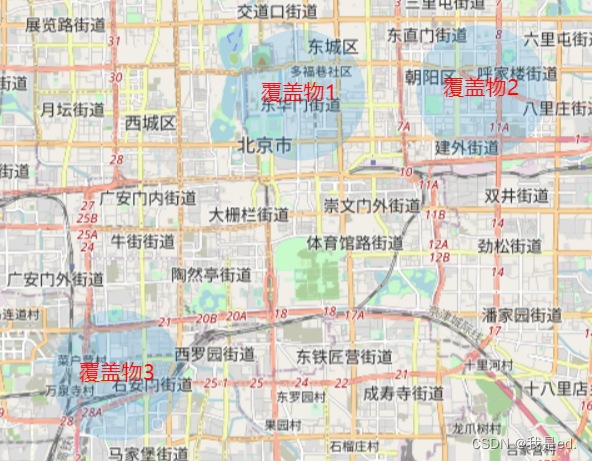
接下来,为每个圆形添加文字标识,例如“覆盖物1”、“覆盖物2”和“覆盖物3”,以便区分不同的圆形区域。
关键代码:
	  // 添加标识
      addLabel() {
        let sites = [{
          site: [116.400819, 39.916263],
          name: '覆盖物1'
        }, {
          site: [116.450819, 39.917263],
          name: '覆盖物2'
        }, {
          site: [116.350819, 39.857263],
          name: '覆盖物3'
        }]
        let features = []
        sites.forEach((item, index) => {
          let feature = new Feature({
            title: item.name,
            geometry: new Point(fromLonLat(item.site)),
          })
          feature.setStyle(
            new Style({
              text: new Text({
                textAlign: 'center',
                textBaseline: 'middle',
                font: 'normal 17px 微软雅黑',
                text: item.name,
                fill: new Fill({
                  color: 'red'
                }),
              })
            })
          )
          features.push(feature)
        })

        let sourceLabel = new VectorSource()
        sourceLabel.addFeatures(features)
        let layerLabel = new VectorLayer({
          opacity: 1
        })
        layerLabel.setSource(sourceLabel)
        map.addLayer(layerLabel)
      },
执行上述代码后,即可得到包含圆形及其对应文字标识的地图效果。
绘制连线
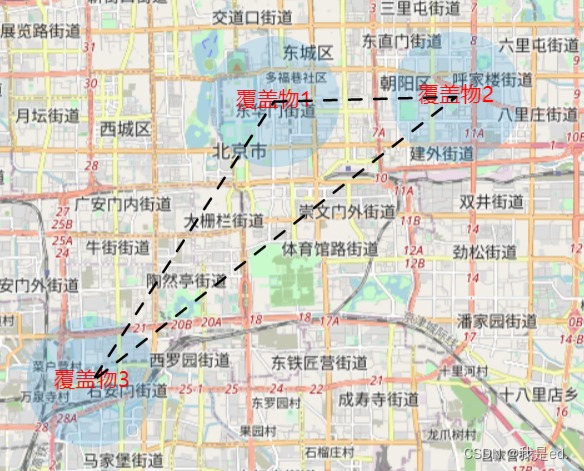
随后,需要将三个圆的圆心两两连接。无论使用虚线还是实线,实现方式均较为简单,直接参考以下代码即可。
	  // 添加连线
      addLink() {
        let sites = [{
          site: [116.400819, 39.916263],
          name: '覆盖物1'
        }, {
          site: [116.450819, 39.917263],
          name: '覆盖物2'
        }, {
          site: [116.350819, 39.857263],
          name: '覆盖物3'
        }]
        sites.push(sites[0])
        let linkData = []
        sites.forEach(item => {
          linkData.push(fromLonLat(item.site))
        })
        let features = []

        let featureLine = new Feature({
          geometry: new LineString(linkData),
        });
        let lineStyle = new Style({
          stroke: new Stroke({
            color: '#000',
            lineDash: [10, 10, 10, 10], // 重点在这
            width: 2,
          }),
        });
        // 添加线的样式
        featureLine.setStyle(lineStyle);
        features.push(featureLine)
        let sourceLink = new VectorSource()
        sourceLink.addFeatures(features)
        let layerLink = new VectorLayer()
        layerLink.setSource(sourceLink)
        map.addLayer(layerLink)
      },
执行上述代码后,地图上三个圆的圆心将两两相连。
标注距离
此部分包含两个步骤:首先计算圆心之间的距离,然后在地图上标注该距离。
可以直接利用连线图层进行操作,通过修改之前的连线代码,在绘制连线的同时计算距离,并在获取距离数据后进行相应的标注显示。
	  // 添加连线
      addLink() {

        let sites = [{
          site: [116.400819, 39.916263],
          name: '覆盖物1'
        }, {
          site: [116.450819, 39.917263],
          name: '覆盖物2'
        }, {
          site: [116.350819, 39.857263],
          name: '覆盖物3'
        }]
        sites.push(sites[0])
        let linkData = []
        sites.forEach(item => {
          linkData.push(fromLonLat(item.site))
        })
        let features = []

        let featureLine = new Feature({
          geometry: new LineString(linkData),
        });
        let lineStyle = new Style({
          stroke: new Stroke({
            color: '#000',
            lineDash: [10, 10, 10, 10], // 重点在这
            width: 2,
          }),
        });
        // 添加线的样式
        featureLine.setStyle(lineStyle);
        features.push(featureLine)

        let distanceList = []
        for (let index = 0; index < sites.length - 1; index++) {
          let site = fromLonLat([(sites[index].site[0] + sites[index + 1].site[0]) / 2, (sites[index].site[1] + sites[index + 1].site[1]) / 2])
          let length = getDistance(sites[index].site, sites[index + 1].site);
          distanceList.push({
            site,
            length,
          })
        }

        distanceList.forEach((item) => {
          let feature = new Feature({
            title: '这是测试用的',
            geometry: new Point(item.site),
          })
          feature.setStyle(
            new Style({
              text: new Text({
                textAlign: 'center',            //位置
                textBaseline: 'middle',         //基准线
                font: 'normal 12px 微软雅黑',    //文字样式
                text: item.length.toFixed(0) + 'm',      //文本内容
                padding: [1, 1, 1, 1],
                backgroundFill: new Fill({       //文本填充样式(即文字颜色)
                  color: '#d5e2f9'
                }),
                fill: new Fill({       //文本填充样式(即文字颜色)
                  color: 'red'
                }),
              })
            })
          )
          features.push(feature)
        })

        let sourceLink = new VectorSource()
        sourceLink.addFeatures(features)
        let layerLink = new VectorLayer()
        layerLink.setSource(sourceLink)
        map.addLayer(layerLink)
      },
至此,最初设定的所有功能效果均已实现。
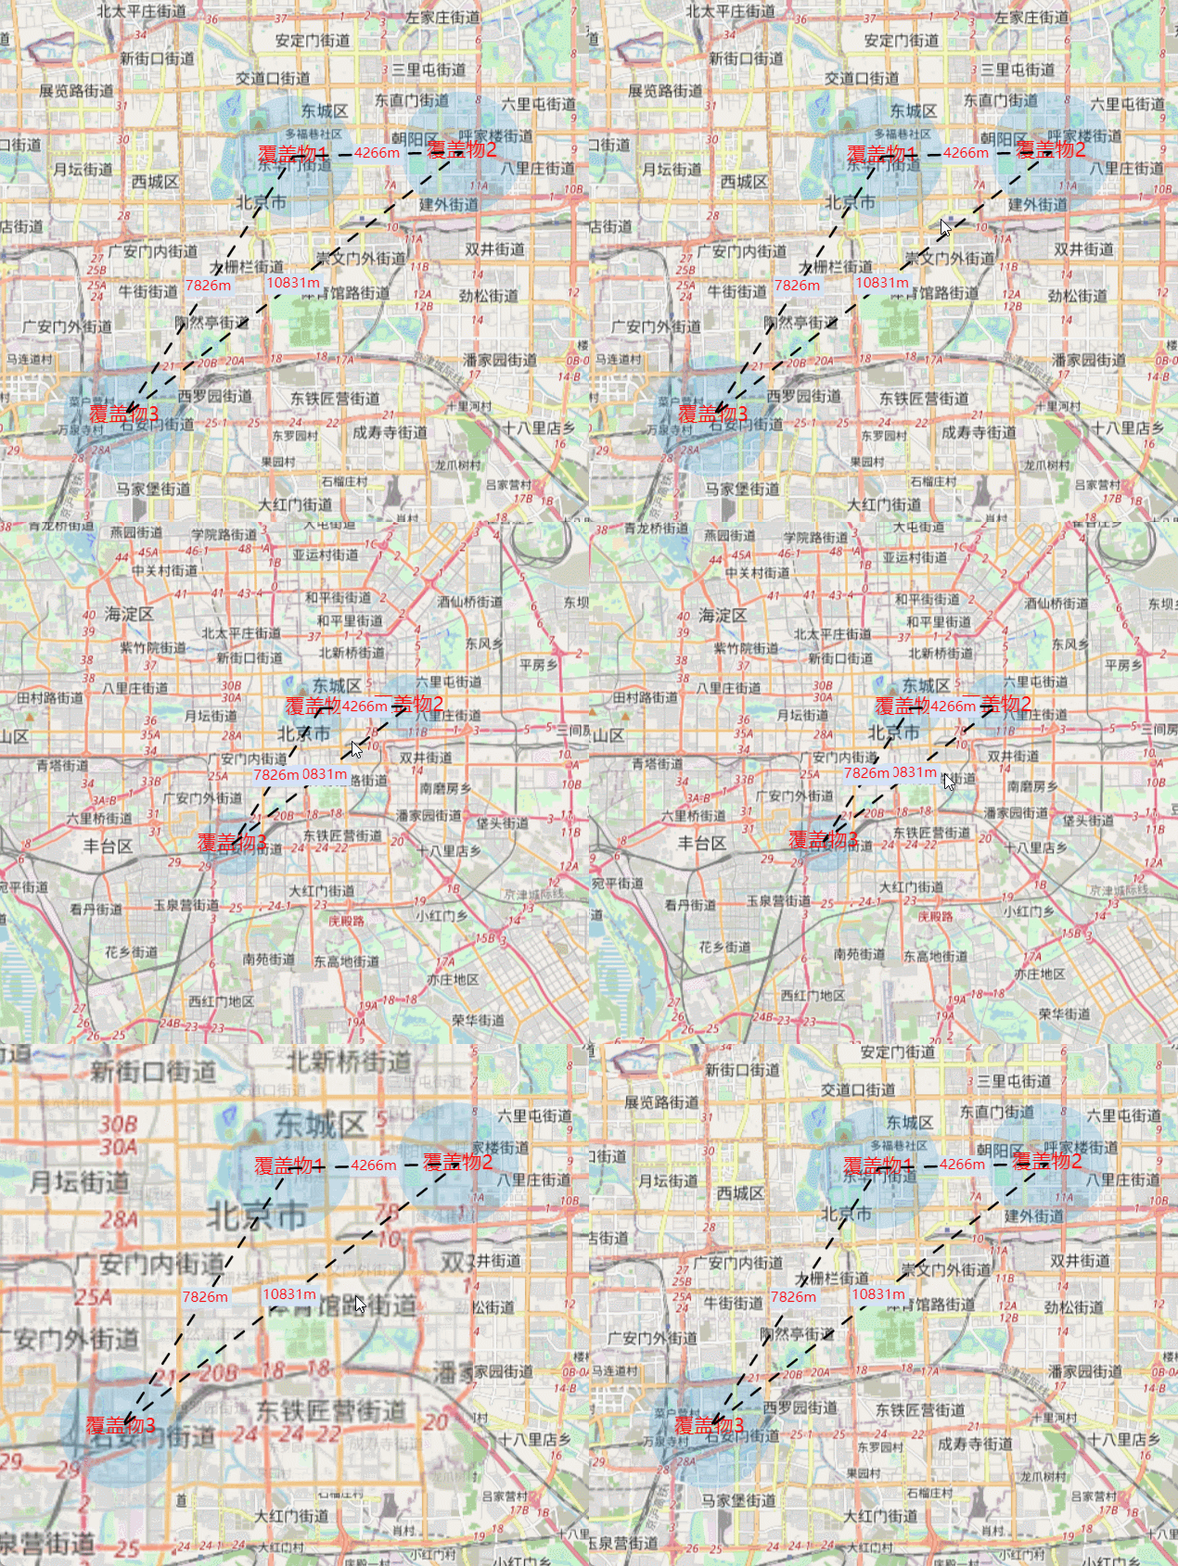
下面提供完整的代码示例供参考。
<template>
  <div style="width:100%;height: 100%;position: relative;">
    <div id="map"></div>
  </div>
</template>

<script>
  import 'ol/ol.css';
  import Map from 'ol/Map';
  import View from 'ol/View';
  import XYZ from 'ol/source/XYZ';
  import * as olProj from 'ol/proj';
  import Draw from 'ol/interaction/Draw';
  import Overlay from 'ol/Overlay';
  import { Circle as CircleStyle, Fill, Stroke, Style } from 'ol/style';
  import { OSM, Vector as VectorSource } from 'ol/source';
  import { Tile as TileLayer, Vector as VectorLayer } from 'ol/layer';
  import Feature from 'ol/Feature';
  import { Point, MultiLineString, LineString, Polygon } from "ol/geom";
  import { fromLonLat } from 'ol/proj';
  import Circle from 'ol/geom/Circle';
  import { ScaleLine, defaults as defaultControls } from 'ol/control';
  import { circular } from 'ol/geom/Polygon';
  import * as olSphere from 'ol/sphere';
  import LinearRing from 'ol/geom/LinearRing';
  import { getTransform } from 'ol/proj';
  import { getArea, getLength, getDistance } from 'ol/sphere';
  import { unByKey } from 'ol/Observable';
  import WMTS from 'ol/source/WMTS';
  import ImageLayer from 'ol/layer/Image';
  import ImageWMS from 'ol/source/ImageWMS';
  import TileWMS from 'ol/source/TileWMS';
  import WMTSTileGrid from 'ol/tilegrid/WMTS';
  import * as olExtent from 'ol/extent';
  import GeoJSON from 'ol/format/GeoJSON';
  import Text from 'ol/style/Text';

  var map = null;  // /地图实例
  var view = null;  // 视图实例

  export default {
    name: "Home",
    components: {
    },
    data() {
      return { }
    },

    mounted() {
      this.initMap()
    },

    methods: {

      // 初始化地图
      initMap() {
        // 实例化Map
        map = new Map({  // 创建一个地图
          layers: [new TileLayer({
            source: new OSM(),
          }),],
          target: 'map',
          view: new View({
            center: fromLonLat([116.403218, 39.92372]),
            zoom: 15,
            constrainResolution: true,  // 设置缩放级别为整数
            smoothResolutionConstraint: false,  // 关闭无级缩放地图
          }),
        });

        view = map.getView()
        // 加载圆形
        this.addPoint()
      },

      // 绘制圆
      addPoint() {
        let sites = [{
          site: [116.400819, 39.916263],
          name: '覆盖物1'
        }, {
          site: [116.450819, 39.917263],
          name: '覆盖物2'
        }, {
          site: [116.350819, 39.857263],
          name: '覆盖物3'
        }]
        let features = []
        sites.forEach((item, index) => {
          let feature = new Feature({
            title: item.name,
            geometry: new Circle(fromLonLat(item.site), this.getRadius(2000)),
          })
          feature.setStyle(
            new Style({
              fill: new Fill({
                color: 'rgba(32, 157, 230, 1)'
              }),
            })
          )
          features.push(feature)
        })
        let source = new VectorSource()
        source.addFeatures(features)
        let layer = new VectorLayer({
          opacity: 0.2
        })
        layer.setSource(source)
        map.addLayer(layer)
        this.addLabel()
        this.addLink()
      },

      // 添加标识
      addLabel() {
        let sites = [{
          site: [116.400819, 39.916263],
          name: '覆盖物1'
        }, {
          site: [116.450819, 39.917263],
          name: '覆盖物2'
        }, {
          site: [116.350819, 39.857263],
          name: '覆盖物3'
        }]
        let features = []
        sites.forEach((item, index) => {
          let feature = new Feature({
            title: item.name,
            geometry: new Point(fromLonLat(item.site)),
          })
          feature.setStyle(
            new Style({
              text: new Text({
                textAlign: 'center',            //位置
                textBaseline: 'middle',         //基准线
                font: 'normal 17px 微软雅黑',    //文字样式
                text: item.name,      //文本内容
                fill: new Fill({       //文本填充样式(即文字颜色)
                  color: 'red'
                }),
              })
            })
          )
          features.push(feature)
        })

        let sourceLabel = new VectorSource()
        sourceLabel.addFeatures(features)
        let layerLabel = new VectorLayer({
          opacity: 1
        })
        layerLabel.setSource(sourceLabel)
        map.addLayer(layerLabel)
      },

      // 添加连线
      addLink() {

        let sites = [{
          site: [116.400819, 39.916263],
          name: '覆盖物1'
        }, {
          site: [116.450819, 39.917263],
          name: '覆盖物2'
        }, {
          site: [116.350819, 39.857263],
          name: '覆盖物3'
        }]
        sites.push(sites[0])
        let linkData = []
        sites.forEach(item => {
          linkData.push(fromLonLat(item.site))
        })
        let features = []

        let featureLine = new Feature({
          geometry: new LineString(linkData),
        });
        let lineStyle = new Style({
          stroke: new Stroke({
            color: '#000',
            lineDash: [10, 10, 10, 10], // 重点在这
            width: 2,
          }),
        });
        // 添加线的样式
        featureLine.setStyle(lineStyle);
        features.push(featureLine)

        let distanceList = []
        for (let index = 0; index < sites.length - 1; index++) {
          let site = fromLonLat([(sites[index].site[0] + sites[index + 1].site[0]) / 2, (sites[index].site[1] + sites[index + 1].site[1]) / 2])
          let length = getDistance(sites[index].site, sites[index + 1].site);
          distanceList.push({
            site,
            length,
          })
        }

        distanceList.forEach((item) => {
          let feature = new Feature({
            title: '这是测试用的',
            geometry: new Point(item.site),
          })
          feature.setStyle(
            new Style({
              text: new Text({
                textAlign: 'center',            //位置
                textBaseline: 'middle',         //基准线
                font: 'normal 12px 微软雅黑',    //文字样式
                text: item.length.toFixed(0) + 'm',      //文本内容
                padding: [1, 1, 1, 1],
                backgroundFill: new Fill({       //文本填充样式(即文字颜色)
                  color: '#d5e2f9'
                }),
                fill: new Fill({       //文本填充样式(即文字颜色)
                  color: 'red'
                }),
              })
            })
          )
          features.push(feature)
        })

        let sourceLink = new VectorSource()
        sourceLink.addFeatures(features)
        let layerLink = new VectorLayer()
        layerLink.setSource(sourceLink)
        map.addLayer(layerLink)
      },

	  // 半径计算
      getRadius(radius) {
        let metersPerUnit = map.getView().getProjection().getMetersPerUnit();
        let circleRadius = radius / metersPerUnit;
        return circleRadius;
      },

    },
  };
</script>
<style scoped>
  #map {
    width: 100%;
    height: 100%;
    background-color: azure;
  }
</style>

<style scoped>
  /deep/.ol-tooltip {
    position: relative;
    background: rgba(0, 0, 0, 0.7);
    border-radius: 4px;
    color: white;
    padding: 4px 8px;
    opacity: 0.7;
    white-space: nowrap;
    font-size: 12px;
    cursor: default;
    user-select: none;
  }

  /deep/.ol-tooltip-measure {
    opacity: 1;
    font-weight: bold;
  }

  /deep/.ol-tooltip-static {
    background-color: #ffcc33;
    color: black;
    border: 1px solid white;
  }

  /deep/.ol-tooltip-measure:before,
  /deep/.ol-tooltip-static:before {
    border-top: 6px solid rgba(0, 0, 0, 0.5);
    border-right: 6px solid transparent;
    border-left: 6px solid transparent;
    content: "";
    position: absolute;
    bottom: -6px;
    margin-left: -7px;
    left: 50%;
  }

  /deep/.ol-tooltip-static:before {
    border-top-color: #ffcc33;
  }
</style>
关于OpenLayers实现根据半径绘制圆形及标注圆心距离的介绍到此结束。如需了解更多OpenLayers绘制圆形的相关内容,建议搜索本站历史文章或继续浏览后续相关文章,感谢支持。