

本文详细介绍JavaScript可视化技术,重点讲解Echarts库的引入、使用及核心配置。内容涵盖Echarts与D3.js、Highcharts等库的对比,演示如何初始化实例、设置标题、提示框、图例及系列数据,并提供蓝丁格尔玫瑰图等示例,帮助开发者快速掌握前端图表开发。
一、可视化概述
- 可视化:通过图表呈现数据,使数据更直观且特性更显著
- 应用场景:涵盖营销、生产及用户数据等领域
二、可视化库综述
主流数据可视化库包括:
- D3.js:Web端评价极高的JavaScript可视化工具库(学习曲线陡峭)
- ECharts.js:百度开源的JavaScript数据可视化库
- Highcharts.js:国外前端可视化库,非商用免费,被众多国际大公司采用
- AntV:蚂蚁金服推出的新一代数据可视化解决方案等
- Highcharts与Echarts的关系类似于Office与WPS
ECharts:基于JavaScript的开源可视化库,兼容PC与移动设备,支持IE8/9/10/11、Chrome、Firefox、Safari等主流浏览器,底层依赖ZRender矢量图形库,提供直观、交互丰富且高度可定制的数据可视化图表
三、Echarts详解
Echarts的引入与使用方法
下载echarts库文件并引入至HTML页面
<script src="./src/echarts.js"></script>创建一个DOM容器
<style>
    .box {
		width: 400px;
		height: 400px;
		cursor: pointer;
	}
</style>
<div class='box'></div>
初始化echarts实例对象
var box = document.querySelector(".box")
var echarts1 = echarts.init(box)
配置选项与数据定义
var option = {
	title: {
		text: 'ECharts 入门示例'
	},
	tooltip: {},
	legend: {
		data: ['销量']
	},
	xAxis: {
		data: ['衬衫', '羊毛衫', '雪纺衫', '裤子', '高跟鞋', '袜子']
	},
	yAxis: {},
	series: [{
		name: '销量',
		type: 'bar',
		data: [5, 20, 36, 10, 10, 20]
	}]
}
将配置项应用于echarts实例
echarts1.setOption(option)基础配置解析
title:标题组件,支持主标题与副标题设置
tooltip:提示框组件
legend:图例组件
series
系列列表:通过type属性指定图表类型
xAxis:直角坐标系grid中的x轴
boundaryGap:坐标轴两边留白策略,设为true时刻度仅作分隔线,标签和数据点位于刻度带中间
yAxis:直角坐标系grid中的y轴
grid:直角坐标系内的绘图网格
color:调色盘颜色列表
注:无需死记硬背,重点在于掌握官方文档的查阅方法
官方文档:Documentation - Apache ECharts
(1)示例:标题组件title配置
              title: {
					show: true,          //是否显示标题组件
					text: '主标题',
					link: "http://www.baidu.com",   //主标题文本超链接
					textStyle: {                   //主标题的文本样式 相当于css的
						color: "blue",
						fontWeight: "100"
					},
					subtext: "副标题",
					subtextStyle: {               //副标题的文本样式
						color: "red",
						fontWeight: "100",
						fontSize: "20px"
					},
					textAlign: "auto",         //整体(包括 text 和 subtext)的水平对齐
					textVerticalAlign: "auto", //整体(包括 text 和 subtext)的垂直对齐
					padding: [5, 10],          //标题内边距
					left: 400,                 //title 组件离容器左侧的距离
					backgroundColor: "yellow"   //标题背景色,默认透明
				},
(2)示例:工具组件toolbox配置
                toolbox: {
					//配置工具
					feature: {
						mytool: {    //自定义的工具名字,只能以 my 开头
							show: true,
							title: "自定义扩展方法",
							icon: "image://https://img2.baidu.com/it/u=1814268193,3619863984&fm=253&app=138&size=w931&n=0&f=JPEG&fmt=auto?sec=1658941200&t=d5f42a41eab8af5c9929fcc6f9e1eff7",
							onclick: function() {
								console.log("点击事件")
							}
						},
						saveAsImage: {
							name: "保存"
						},
						restore: {      //配置项还原
						},
						dataView: { //数据视图工具,可展现当前图表所用的数据,编辑后可动态更新
						},
						dataZoom: {},    //数据区域缩放
						magicType: {      //动态类型切换
							type: ['line', 'bar', 'stack']
						}
					}
				},
(3)示例:提示框组件tooltip配置
            tooltip: {
					show: true,
					trigger: "axis", //触发类型 "none"||"axis"
					showContent: false,   // 是否显示提示框浮层
					alwaysShowContent: true,  //是否永远显示提示框内容
					triggerOn: "click",         //提示框触发的条件
					backgroundColor: "gold",
					textStyle: {
						color: "white"
					},
					axisPointer: {     //是配置坐标轴指示器的快捷方式
						type: "cross",  //指示器类型 line shadow none cross
						axis: "x",      //指示器的坐标轴
						snap: true,     //坐标轴指示器是否自动吸附到点上
                        label: {        //坐标轴指示器的文本标签
							show: true,
							color: "red",
						 	formatter: ({    //文本标签文字的格式化器
						 		value
						 	}) => {
								console.log(value)
						 		return `--${value}` //value*2
						 	}
						 }
					}
				},
(4)示例:图例组件legend配置
legend: {
					type: "scroll",     //图例的类型 plain普通图例 scroll可滚动翻页的图例
					orient: "vertical",  //图例列表的布局朝向 vertical horizontal
					data: [{
						name: '销量1',   //图例项的名称
						icon: "circle",   //图例项的 icon
						itemStyle: {
							color: "red"
						}
					}, {
						name: '销量2',
						icon: "rect",
						itemStyle: {
							color: "red"
						}
					}, {
						name: '纯利1',
						icon: "triangle",
						textStyle: {
							color: "red",
							fontSize: "20px"
						}
					}, {
						name: '纯利2',
						icon: "path://",   //'path://' 将图标设置为任意的矢量路径
						icon: "image://url",       //通过图片链接设置为图片
						icon:  "image://https://img2.baidu.com/it/u=1814268193,3619863984&fm=253&app=138&size=w931&n=0&f=JPEG&fmt=auto?sec=1658941200&t=d5f42a41eab8af5c9929fcc6f9e1eff7"   //通过图片编码设置为图片
					  }]
				   },
(5)示例:系列列表series配置
              series: [{
					name: "某某系列1",
					type: 'line',
					colorBy: "series", //按系列分配调色盘中的颜色,同一系列中的所有数据都是用相同的颜色
					symbol: "rect",     //标记的图形 设置拐点
					cursor: "move",
					label: {
						show: true    //是否显示标签文字
					},
					endLabel: {       //折线端点的标签
						show: true
					},
					labelLine: {
						show: true,   //是否显示连接线
						smooth: true    //是否平滑
					},
					lineStyle: {       //标签的视觉引导线配置
						color: "red",
						width: 2,
						join: "miter"  //设置2个长度不为0的相连部分如何连接在一起的属性
					},
					smooth: 0.3,
					data: [420, 432, 401, 434, 190, 130, 120],
				}, {
					name: "某某系列2",
					type: 'line',
					symbol: "arrow",
					symbolSize: 10,     // 拐点大小
					data: [860, 962, 961, 964, 1260, 1360, 1360],
				}]
			};
(6)示例:直角坐标系grid中的x、y轴配置(原理类似)
 xAxis: {
     show: true;  //是否显示x轴
     data: ['衬衫', '羊毛衫', '雪纺衫', '裤子', '高跟鞋', '袜子']   //类目数据,在类目轴
     position:'top'   //x轴的位置
     name:'坐标轴的名称'
     axisTick: {
         show: false // 去除刻度线
     },
     axisLabel: {
         color: '#4c9bfd' // 文本颜色
     },
     axisLine: {
         show: false // 去除轴线
     },
     boundaryGap: false  // 去除轴内间距
 },
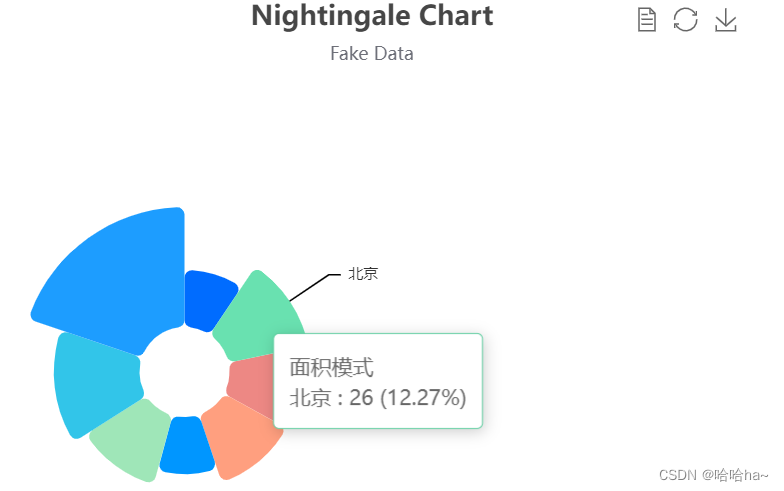
(7)蓝丁格尔玫瑰图示例
<style>
    .box {
      width: 500px;
      height: 500px;
    }
</style>
<div class="box"></div>
<script>
    var box = document.querySelector(".box")
    var ect = echarts.init(box)
    option = {
      title: {
        text: 'Nightingale Chart',
        subtext: 'Fake Data',
        left: 'center'
      },
      tooltip: {
        trigger: 'item',
        formatter: '{a} <br/>{b} : {c} ({d}%)'
      },
      toolbox: {
        show: true,
        feature: {
          mark: {
            show: true
          },
          dataView: {
            show: true,
            readOnly: false
          },
          restore: {
            show: true
          },
          saveAsImage: {
            show: true
          }
        }
      },
      series: [{
        name: '面积模式',
        type: 'pie',
        radius: [30, 110],
        center: ['25%', '50%'],
        roseType: 'radius',
        color: ['#006cff', '#60cda0', '#ed8884', '#ff9f7f', '#0096ff', '#9fe6b8', '#32c5e9', '#1d9dff'],
        itemStyle: {
          borderRadius: 5
        },
        label: {
          show: false,
          fontSize: 10
        },
        emphasis: {
          label: {
            show: true
          }
        },
        labelLine: {
          // 连接扇形图线长
          length: 6,
          // 连接文字线长
          length2: 8
        },
        data: [{
            value: 20,
            name: '云南'
          },
          {
            value: 26,
            name: '北京'
          },
          {
            value: 24,
            name: '山东'
          },
          {
            value: 25,
            name: '河北'
          },
          {
            value: 20,
            name: '江苏'
          },
          {
            value: 25,
            name: '浙江'
          },
          {
            value: 30,
            name: '四川'
          },
          {
            value: 42,
            name: '湖北'
          }
        ]
      }, ]
    };
    ect.setOption(option)
</script>
效果图展示:
本文关于JavaScript可视化与Echarts的详细介绍到此结束,更多相关内容请搜索本站历史文章或继续浏览后续文章,感谢支持!