ECharts实战:雷达图与折柱混合图表绘制详解

作者:阿沐

时间:2026-10-25

浏览:582

本文详细介绍如何利用ECharts实现雷达图和折柱混合图的绘制。通过具体代码示例,解析雷达图指标配置及折柱混合图的Tooltip、Legend设置,帮助开发者解决官方实例中未涵盖的复杂图表效果,适用于数据大屏开发场景。

文章目录

导语

在实际根据设计图开发ECharts图表时,往往会遇到官方示例中未直接提供的视觉效果。本文在代码中补充了一些常用且实用的配置效果,并添加了详细注释以便理解。

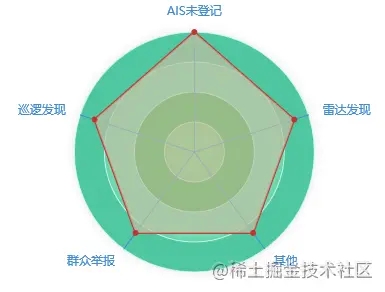
雷达图

var option = {
    radar: [{
            //数据名称
            indicator: [{
                            text: 'AIS未登记'
                    },
                    {
                            text: '巡逻发现'
                    },
                    {
                            text: '群众举报'
                    },
                    {
                            text: '其他'
                    },
                    {
                            text: '雷达发现'
                    }
            ],
            center: ['50%', '50%'],
            radius: 120,
            startAngle: 90,
            splitNumber: 4,
            shape: 'circle',
            axisName: {
                    formatter: '【{value}】',
                    color: '#428BD4'//颜色
            },
            splitArea: {
                    areaStyle: {
                            color: ['#7BD685', '#34B54B', '#70DEB3', '#4FC7A0'], //内部圈圈的颜色
                            shadowColor: 'rgba(0, 0, 0, 0.1)', //内部线的颜色
                            shadowBlur: 10
                    }
            },
            //线颜色
            axisLine: {
                    lineStyle: {
                            color: '#428BD4'
                    }
            },
            splitLine: {
                    lineStyle: {
                            color: 'rgba(211, 253, 250, 0.8)'
                    }
            }

    }],
    //鼠标放上悬浮展示的内容
    tooltip: {
            trigger: 'item'
    },
    series: [{
            name: '表特征分布',
            type: 'radar',
            symbol: 'circle', //拐点样式
            symbolSize: 6, // 拐点的大小
            emphasis: {
                    lineStyle: {
                            width: 4
                    }
            },
            data: [{
                    value: [60, 5, 1, 1, 1500],
                    name: '',
                    areaStyle: {
                       color: '#C1BFA1'
                    }
                 }
            ]
    }]
};
var myChartecharts = echarts.init(document.getElementById('btzfb'));
myChartecharts.setOption(option);

效果
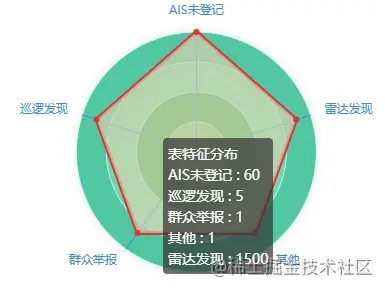
导语

导语

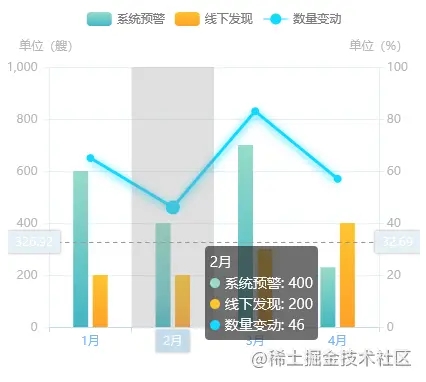
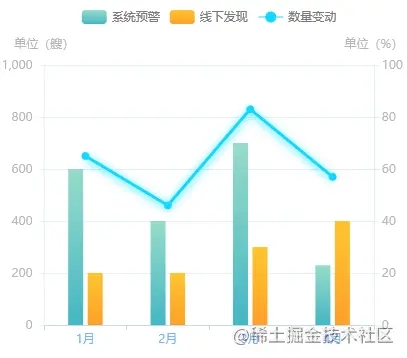
折柱图

//
var optionbdtj = {
        tooltip: {
                trigger: 'axis',
                axisPointer: {
                        type: 'cross',
                        crossStyle: {
                                color: '#999'
                        }
                }
        },
        title: {},
        legend: {
                data: ['系统预警', '线下发现', '数量变动'],
                textStyle: {
                        color: '#7A7A7A'
                },
        },
        xAxis: [{
                type: 'category',
                data: ['1月', '2月', '3月', '4月'],
                axisPointer: {
                        type: 'shadow'
                },
                axisLine: {
                        lineStyle: { //改变xy轴线条的颜色
                                color: "#C3DCEA",
                                width: 1 //这里是为了突出显示加上的
                        }
                },
                axisLabel: {
                        textStyle: { //改变xy轴上文字的颜色
                                color: "#75B4FC"
                        }
                }

        }],

        yAxis: [{
                        type: 'value',
                        name: '单位(艘)',
                        min: 0,
                        max: 1000,
                        interval: 200,
                        axisLine: {
                                lineStyle: { //改变xy轴线条的颜色
                                        color: "#E5F0F6",
                                        width: 1 //这里是为了突出显示加上的
                                }
                        },
                        axisLabel: {
                                formatter: '{value} ',
                                color: '#B7B7B7'
                        },
                        splitLine: {
                                lineStyle: { //改变xy轴线条的颜色
                                        color: "#E5F0F6",
                                        width: 1 //这里是为了突出显示加上的
                                }
                        },
                        nameTextStyle: {
                                color: '#B7B7B7'
                        }
                },
                {
                        type: 'value',
                        name: '单位(%)',
                        min: 0,
                        max: 100,
                        interval: 20, //间隔数
                        axisLine: {
                                lineStyle: { //改变xy轴线条的颜色
                                        color: "#E5F0F6",
                                        width: 1 //这里是为了突出显示加上的
                                }
                        },
                        axisLabel: {
                                formatter: '{value} ',
                                color: '#B7B7B7'
                        },
                        splitLine: {
                                lineStyle: { //改变xy轴线条的颜色
                                        color: "#E5F0F6",
                                        width: 1 //这里是为了突出显示加上的
                                }
                        },
                        nameTextStyle: {
                                color: '#B7B7B7'
                        }
                }
        ],
        series: [{
                        name: '系统预警',
                        type: 'bar',
                        barWidth: 15, // 柱子宽度
                        tooltip: {
                                valueFormatter: function(value) {
                                        return value + ' ';
                                }
                        },
                        itemStyle: {
                                color: new echarts.graphic.LinearGradient(0, 0, 0, 1, [{
                                                offset: 0,
                                                color: '#96DBCA'
                                        },
                                        {
                                                offset: 0.5,
                                                color: '#6EC9C6'
                                        },
                                        {
                                                offset: 1,
                                                color: '#43B6C3'
                                        }
                                ])
                        },
                        emphasis: {
                                itemStyle: {
                                        color: new echarts.graphic.LinearGradient(0, 0, 0, 1, [{
                                                        offset: 0,
                                                        color: '#96DBCA'
                                                },
                                                {
                                                        offset: 0.7,
                                                        color: '#6EC9C6'
                                                },
                                                {
                                                        offset: 1,
                                                        color: '#43B6C3'
                                                }
                                        ])
                                }
                        },
                        data: [600, 400, 700, 230, 250, 760, 135, 162, 320, 200, 600, 300]
                },
                {
                        name: '线下发现',
                        type: 'bar',
                        barWidth: 15, // 柱子宽度
                        tooltip: {
                                valueFormatter: function(value) {
                                        return value + ' ';
                                }
                        },

                        itemStyle: {
                                color: new echarts.graphic.LinearGradient(0, 0, 0, 1, [{
                                                offset: 0,
                                                color: '#FEC52F'
                                        },
                                        {
                                                offset: 0.5,
                                                color: '#FEB32C'
                                        },
                                        {
                                                offset: 1,
                                                color: '#FE9F29'
                                        }
                                ])
                        },
                        emphasis: {
                                itemStyle: {
                                        color: new echarts.graphic.LinearGradient(0, 0, 0, 1, [{
                                                        offset: 0,
                                                        color: '#FEC52F'
                                                },
                                                {
                                                        offset: 0.7,
                                                        color: '#FEB32C'
                                                },
                                                {
                                                        offset: 1,
                                                        color: '#FE9F29'
                                                }
                                        ])
                                }
                        },
                        data: [200, 200, 300, 400, 600, 100, 200, 230, 230, 160, 120, 610]
                },
                {
                        name: '数量变动',
                        type: 'line',
                        symbolSize: 8, //实心大小
                        symbol: 'circle', //实心
                        yAxisIndex: 1,
                        lineStyle: {
                                width: 3,
                                shadowColor: 'rgba(0, 216, 255, 1)', //阴影
                                shadowBlur: 8,
                                shadowOffsetY: 2
                        },
                        tooltip: {
                                valueFormatter: function(value) {
                                        return value + ' ';
                                }
                        },
                        itemStyle: {
                                color: new echarts.graphic.LinearGradient(0, 0, 0, 1, [{
                                                offset: 0,
                                                color: '#14D8FD'
                                        },
                                        {
                                                offset: 0.5,
                                                color: '#14D8FD'
                                        },
                                        {
                                                offset: 1,
                                                color: '#14D8FD'
                                        }
                                ])
                        },
                        data: [65, 46, 83, 57]
                }
        ]
};
var myChartbdtj = echarts.init(document.getElementById('bdtj'));
myChartbdtj.setOption(optionbdtj);

效果

导语

导语

总结

至此,关于如何使用ECharts绘制雷达图及折柱混合图的教程已介绍完毕。如需了解更多相关ECharts雷达图与折柱混合内容,建议搜索本站历史文章或继续浏览后续相关文章。感谢大家的支持!

实用工具推荐

电子包浆

绿化、压缩、噪点和虚拟水印,自由调节做旧程度。

使用 ›
图片压缩

选择画质和输出格式,预览压缩前后的大小。

使用 ›
相关文章